🚀 TradeAx: Predict the Market, Don't Follow It
The TradeAx team presents technology that transforms market chaos into clear guidelines. We don't guess - we analyze data to show where and when the price will reverse with a given strength.
Predictive Levels: How It Works?
Our algorithms process millions of trades, volumes, and market maker activity in real-time to calculate:
- Exact price zones - levels where reversal is most likely.
- Reaction strength - expected bounce percentage (e.g., 5%, 10% or more).
- Forecast validity period - from minutes to months.
➕ New: Instant Notifications
No need to track dozens of assets - TradeAx will do it for you. As soon as the price reaches the predicted level, you receive a notification with details:
- Asset name
- Predicted bounce strength
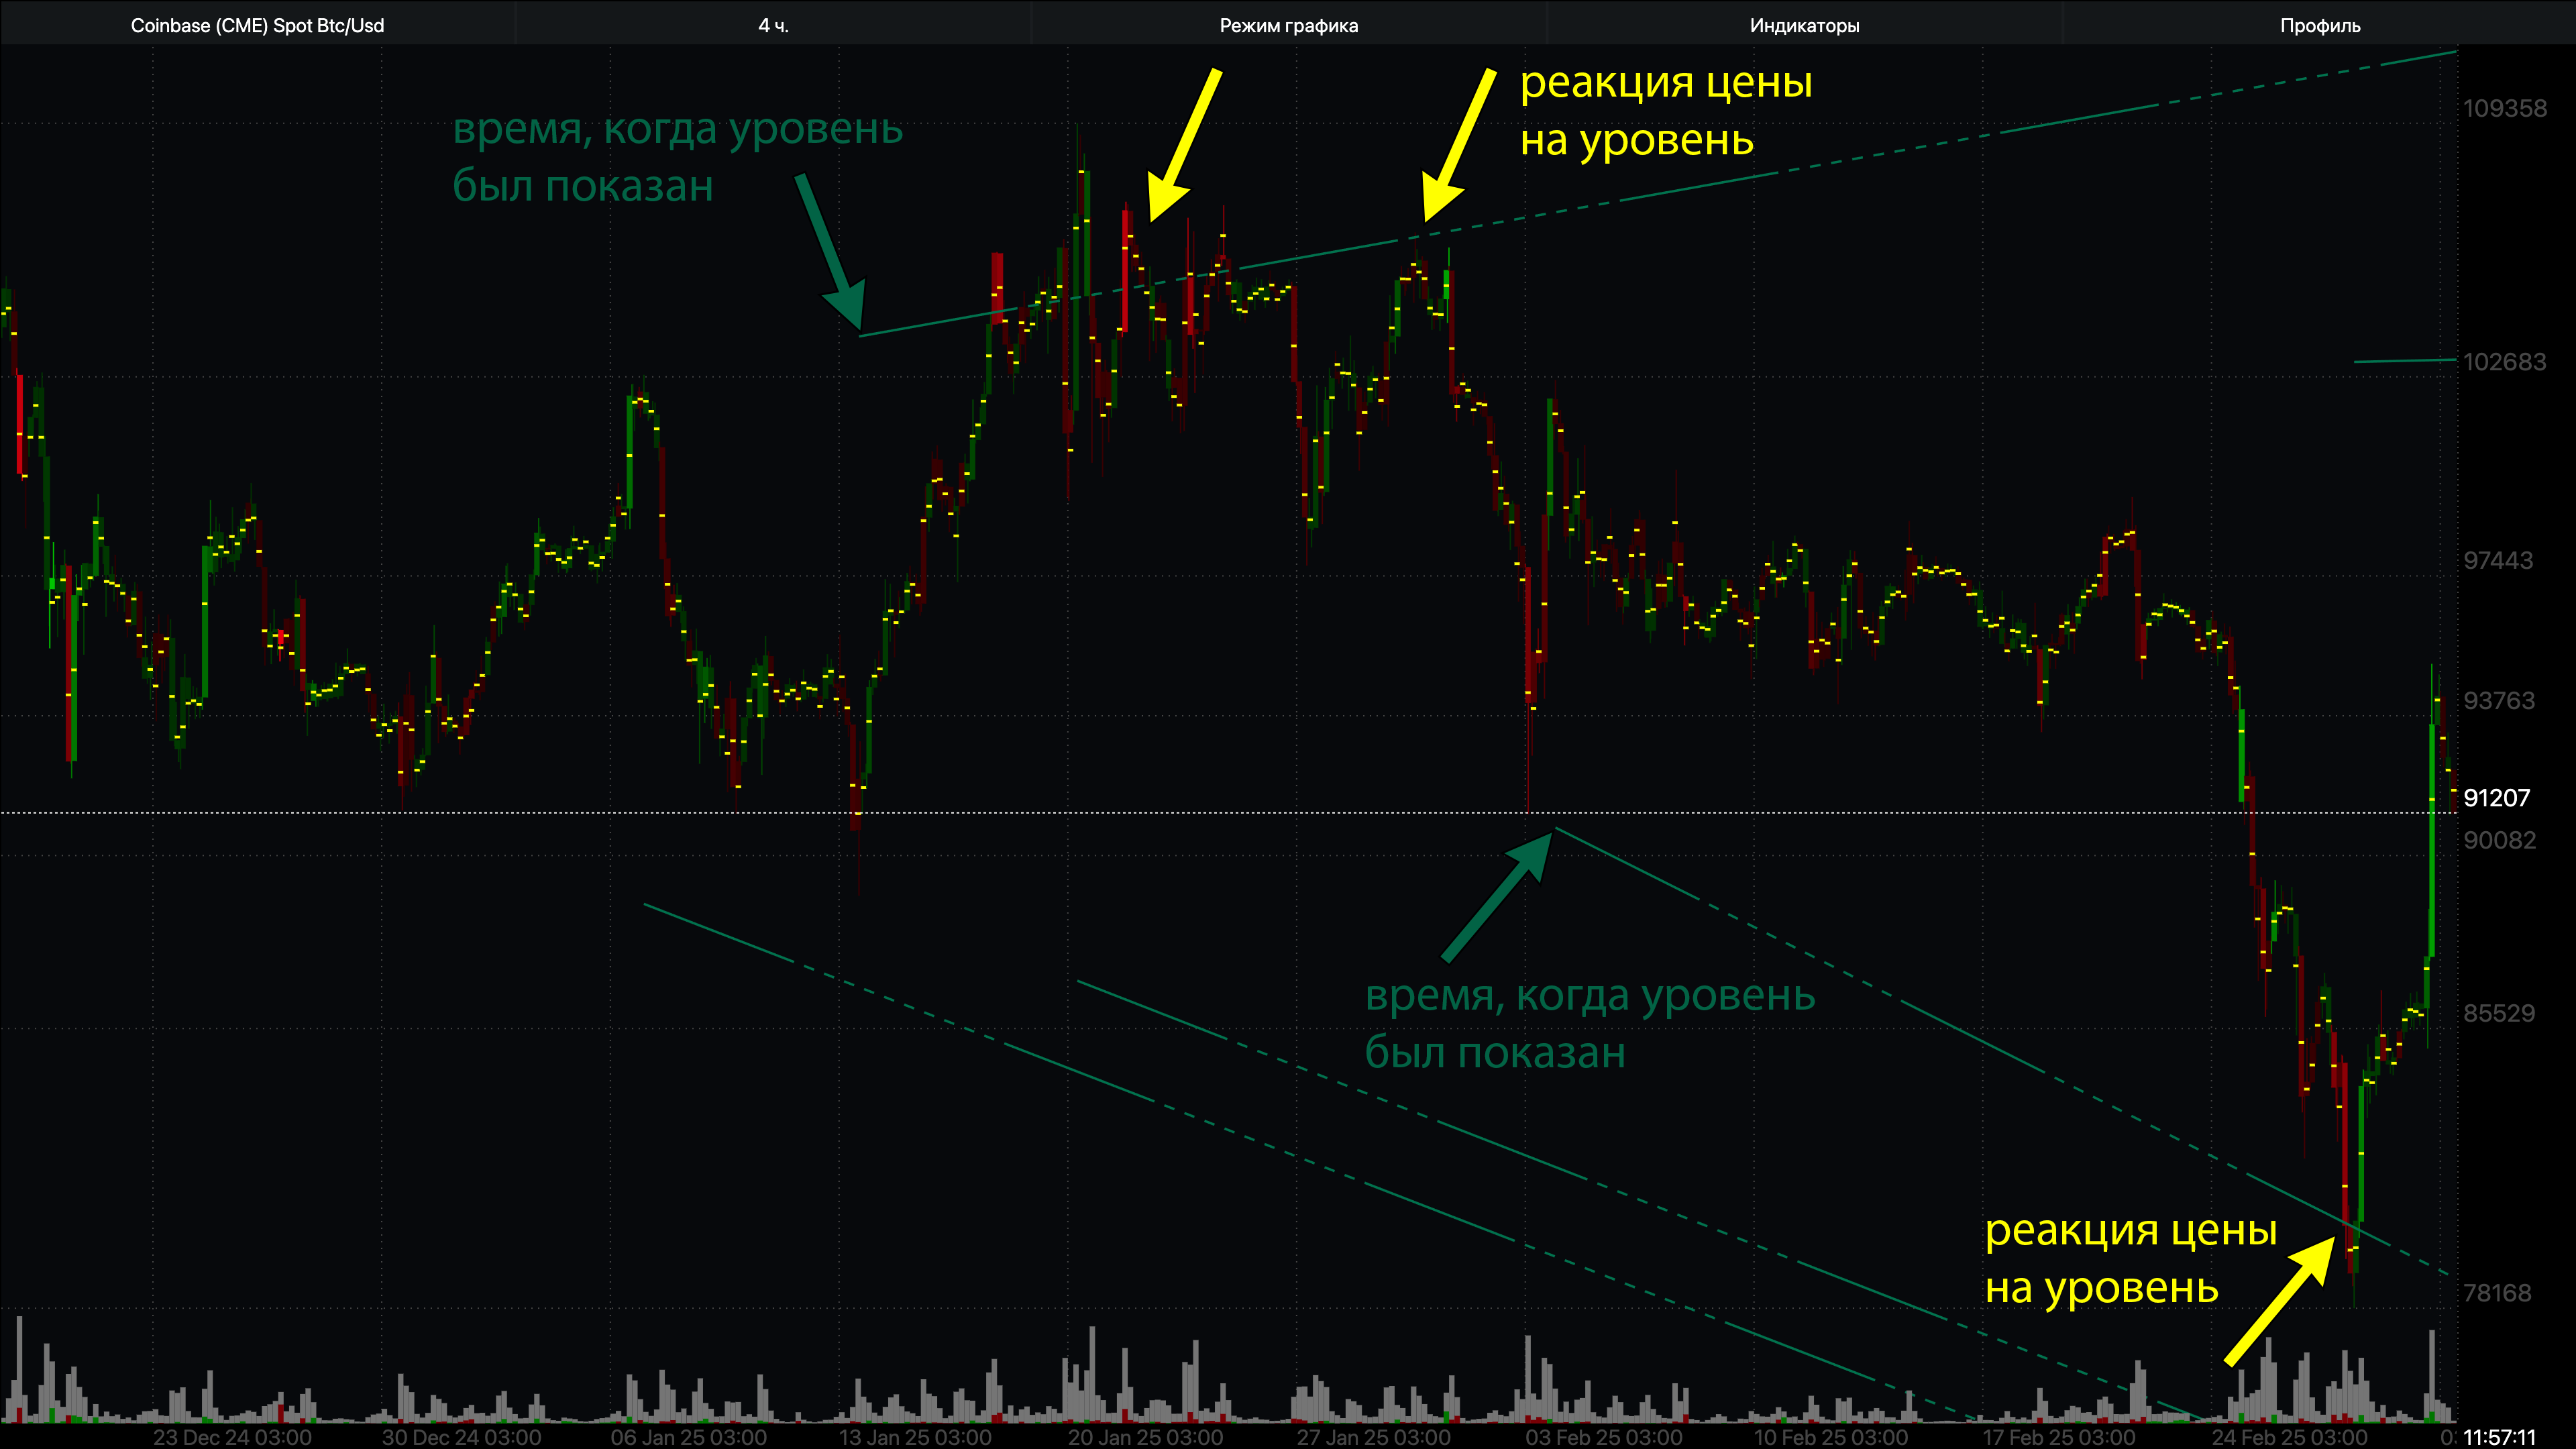
📌 Important:
Levels are not recalculated after plotting. Once the algorithm identifies a zone with specified parameters, it's fixed on the chart. This avoids "double interpretations" and allows for clear action planning.
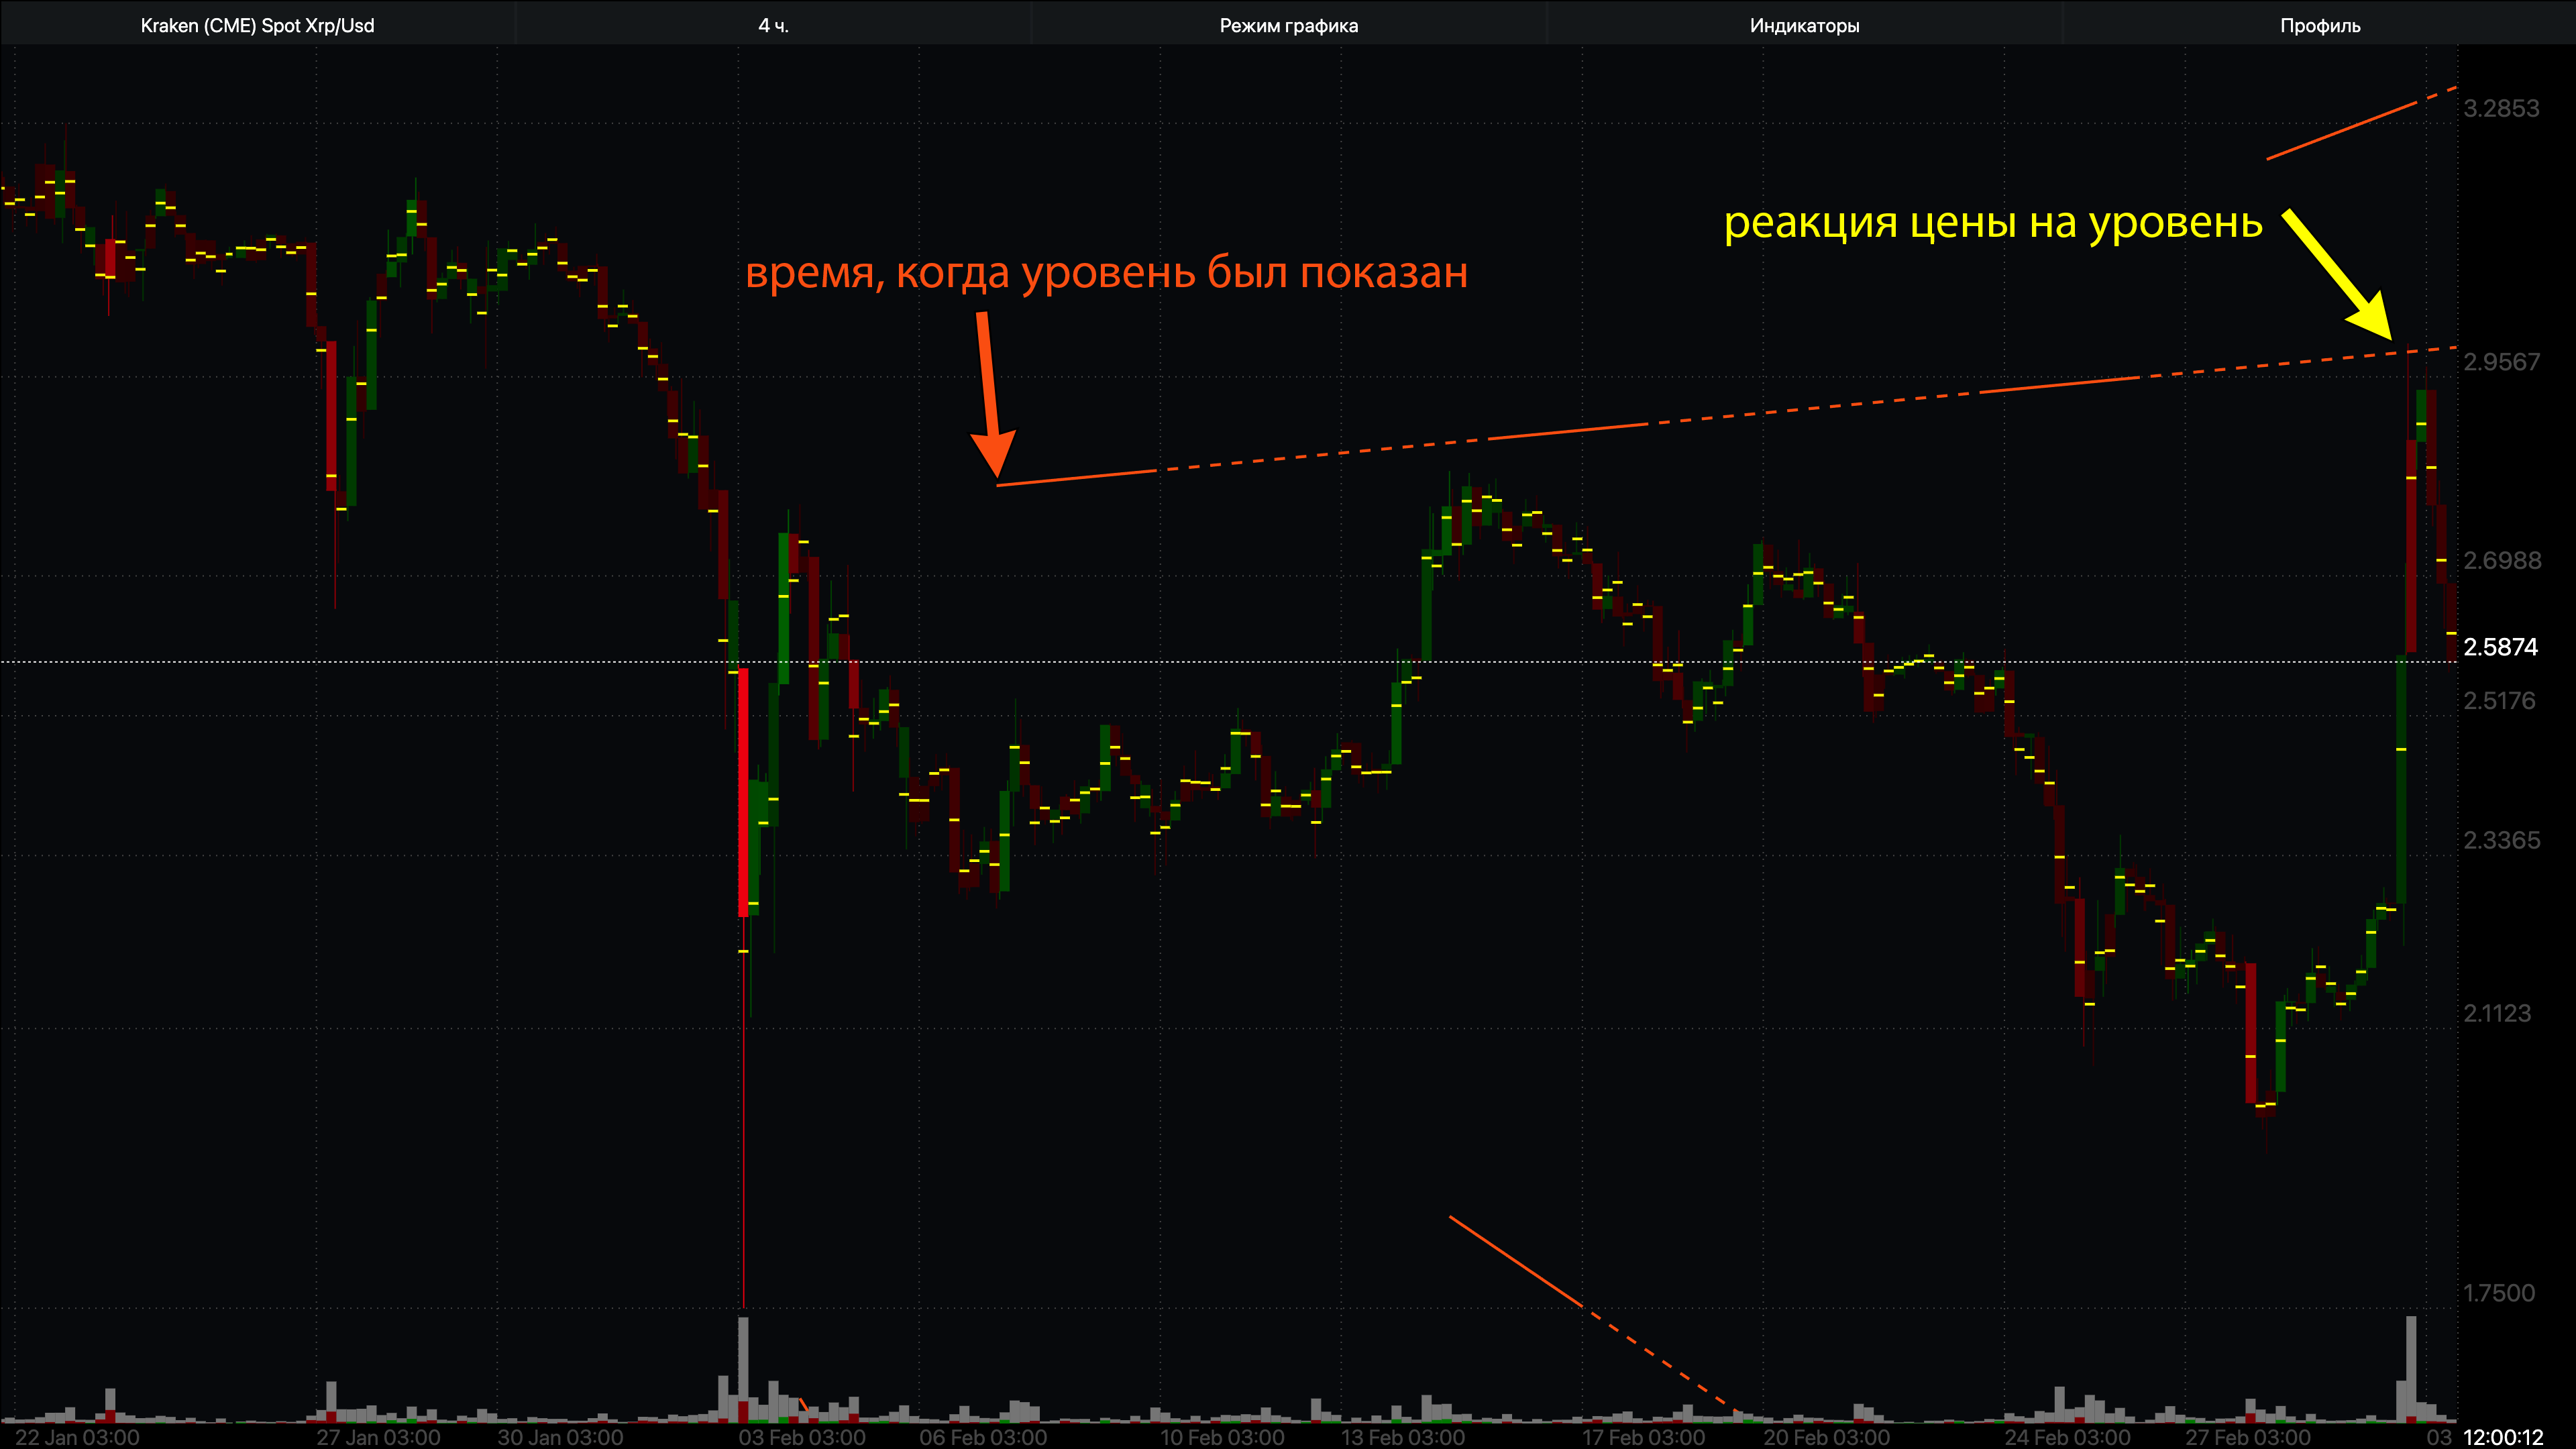
📈 Example:
When selecting the "5% bounce" parameter, the platform will show levels where:
- Large orders are concentrated - institutions are ready to act.
- Delta signals imbalance - supply/demand reach a "critical point".
- Historical statistics confirm - in such conditions, ≥5% bounce occurred in 87% of cases.
✨ What Makes TradeAx Unique?
- "While others draw levels randomly" - we calculate the reversal point and bounce percentage.
- Monitoring automation - notifications save up to 3 hours daily on chart analysis.
- Stability instead of "floating" lines - levels don't change after calculation, reducing emotional stress.
Forecast horizon for your style:
- Minutes/hours - for scalpers catching volatility.
- Days/weeks - for swing traders working with corrections.
- Months - for investors seeking trend entry points.