Ключевые возможности:
📊 1. SMARTCANDLES & MARKETDELTA: АНАЛИЗ РЕАЛЬНОГО ОБЪЕМА И ДЕНЕЖНОГО ПОТОКА
Эти инструменты позволяют точно определять, сколько и по каким ценам реальные деньги входят на рынок или покидают его. Главное преимущество — вы получаете возможность видеть за масками рынка: как крупные участники (маркет-мейкеры) и "кухни" перегоняют средства между своими же кошельками, создавая искусственную активность и рисуя фейковый объем.
🔍 Ключевое преимущество:
Вы получаете понимание емкости рынка. Вы видите, какой реальный объем денег поддерживает тренд. Это знание страхует вас от роли трейдера, который действует вслепую и рискует открыть позицию на слабом объеме, неосознанно своими же сделками нарушая логику движения. Вы торгуете осознанно, опираясь на реальную ликвидность, а не на рыночный шум.
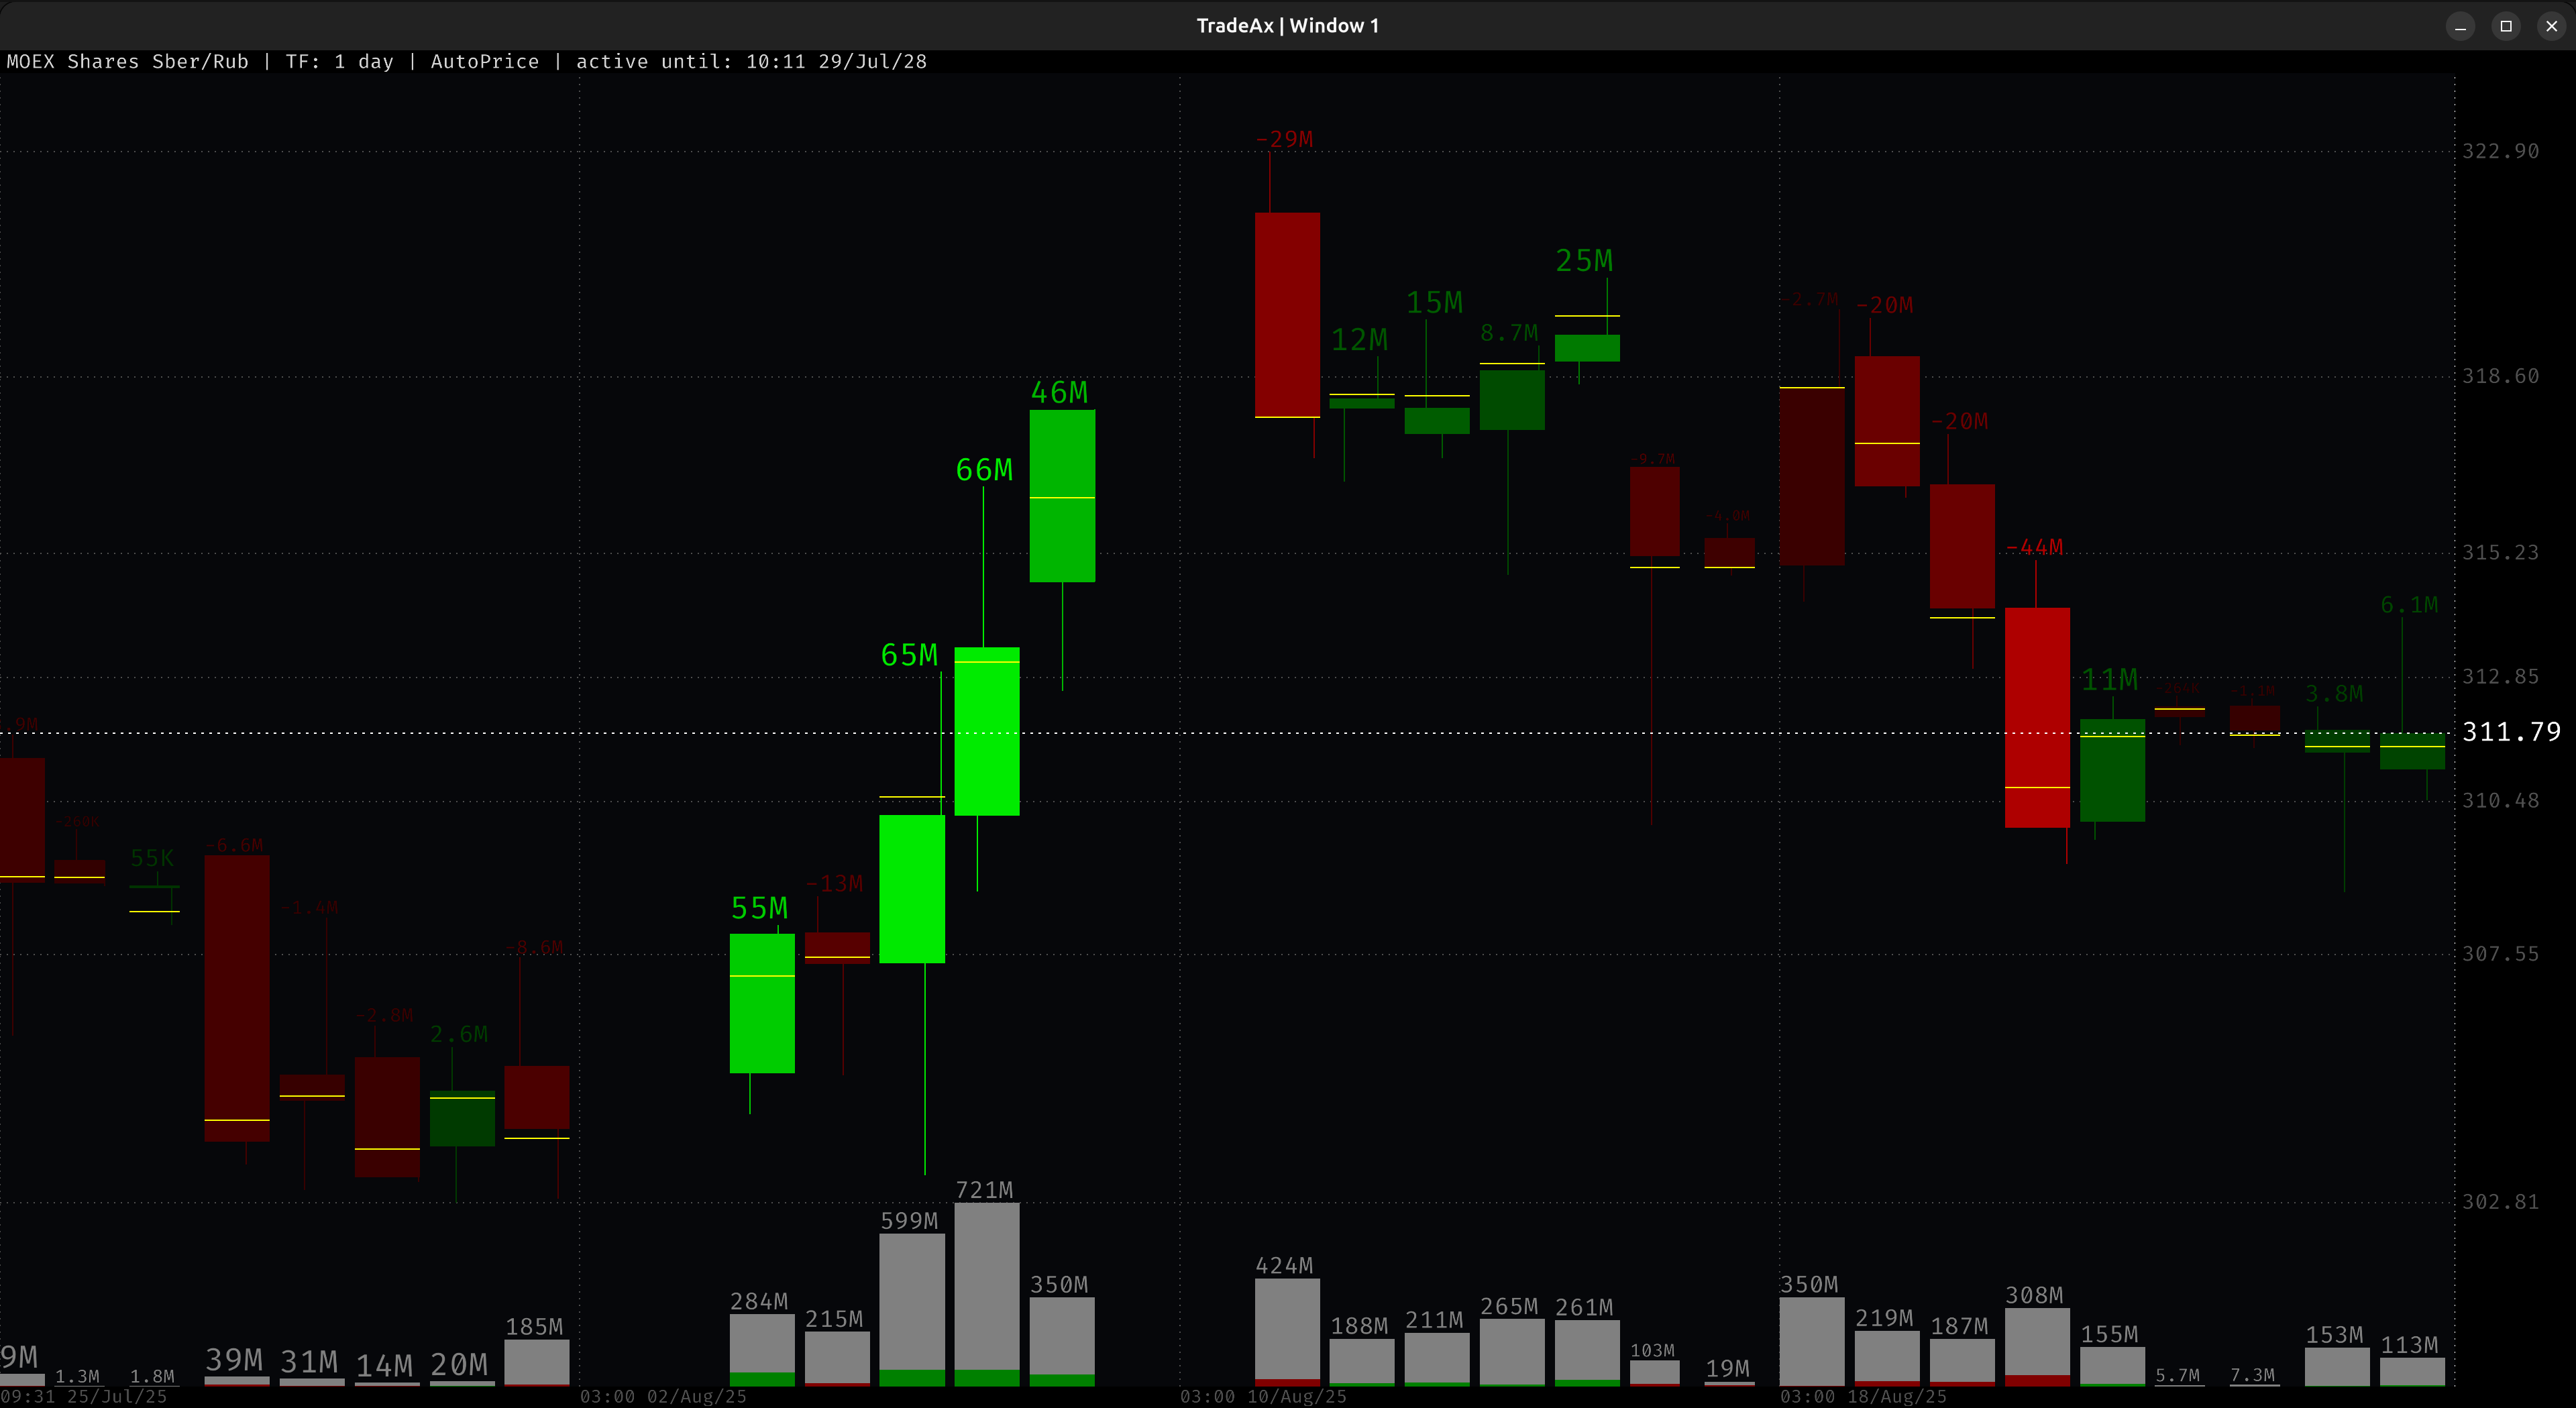
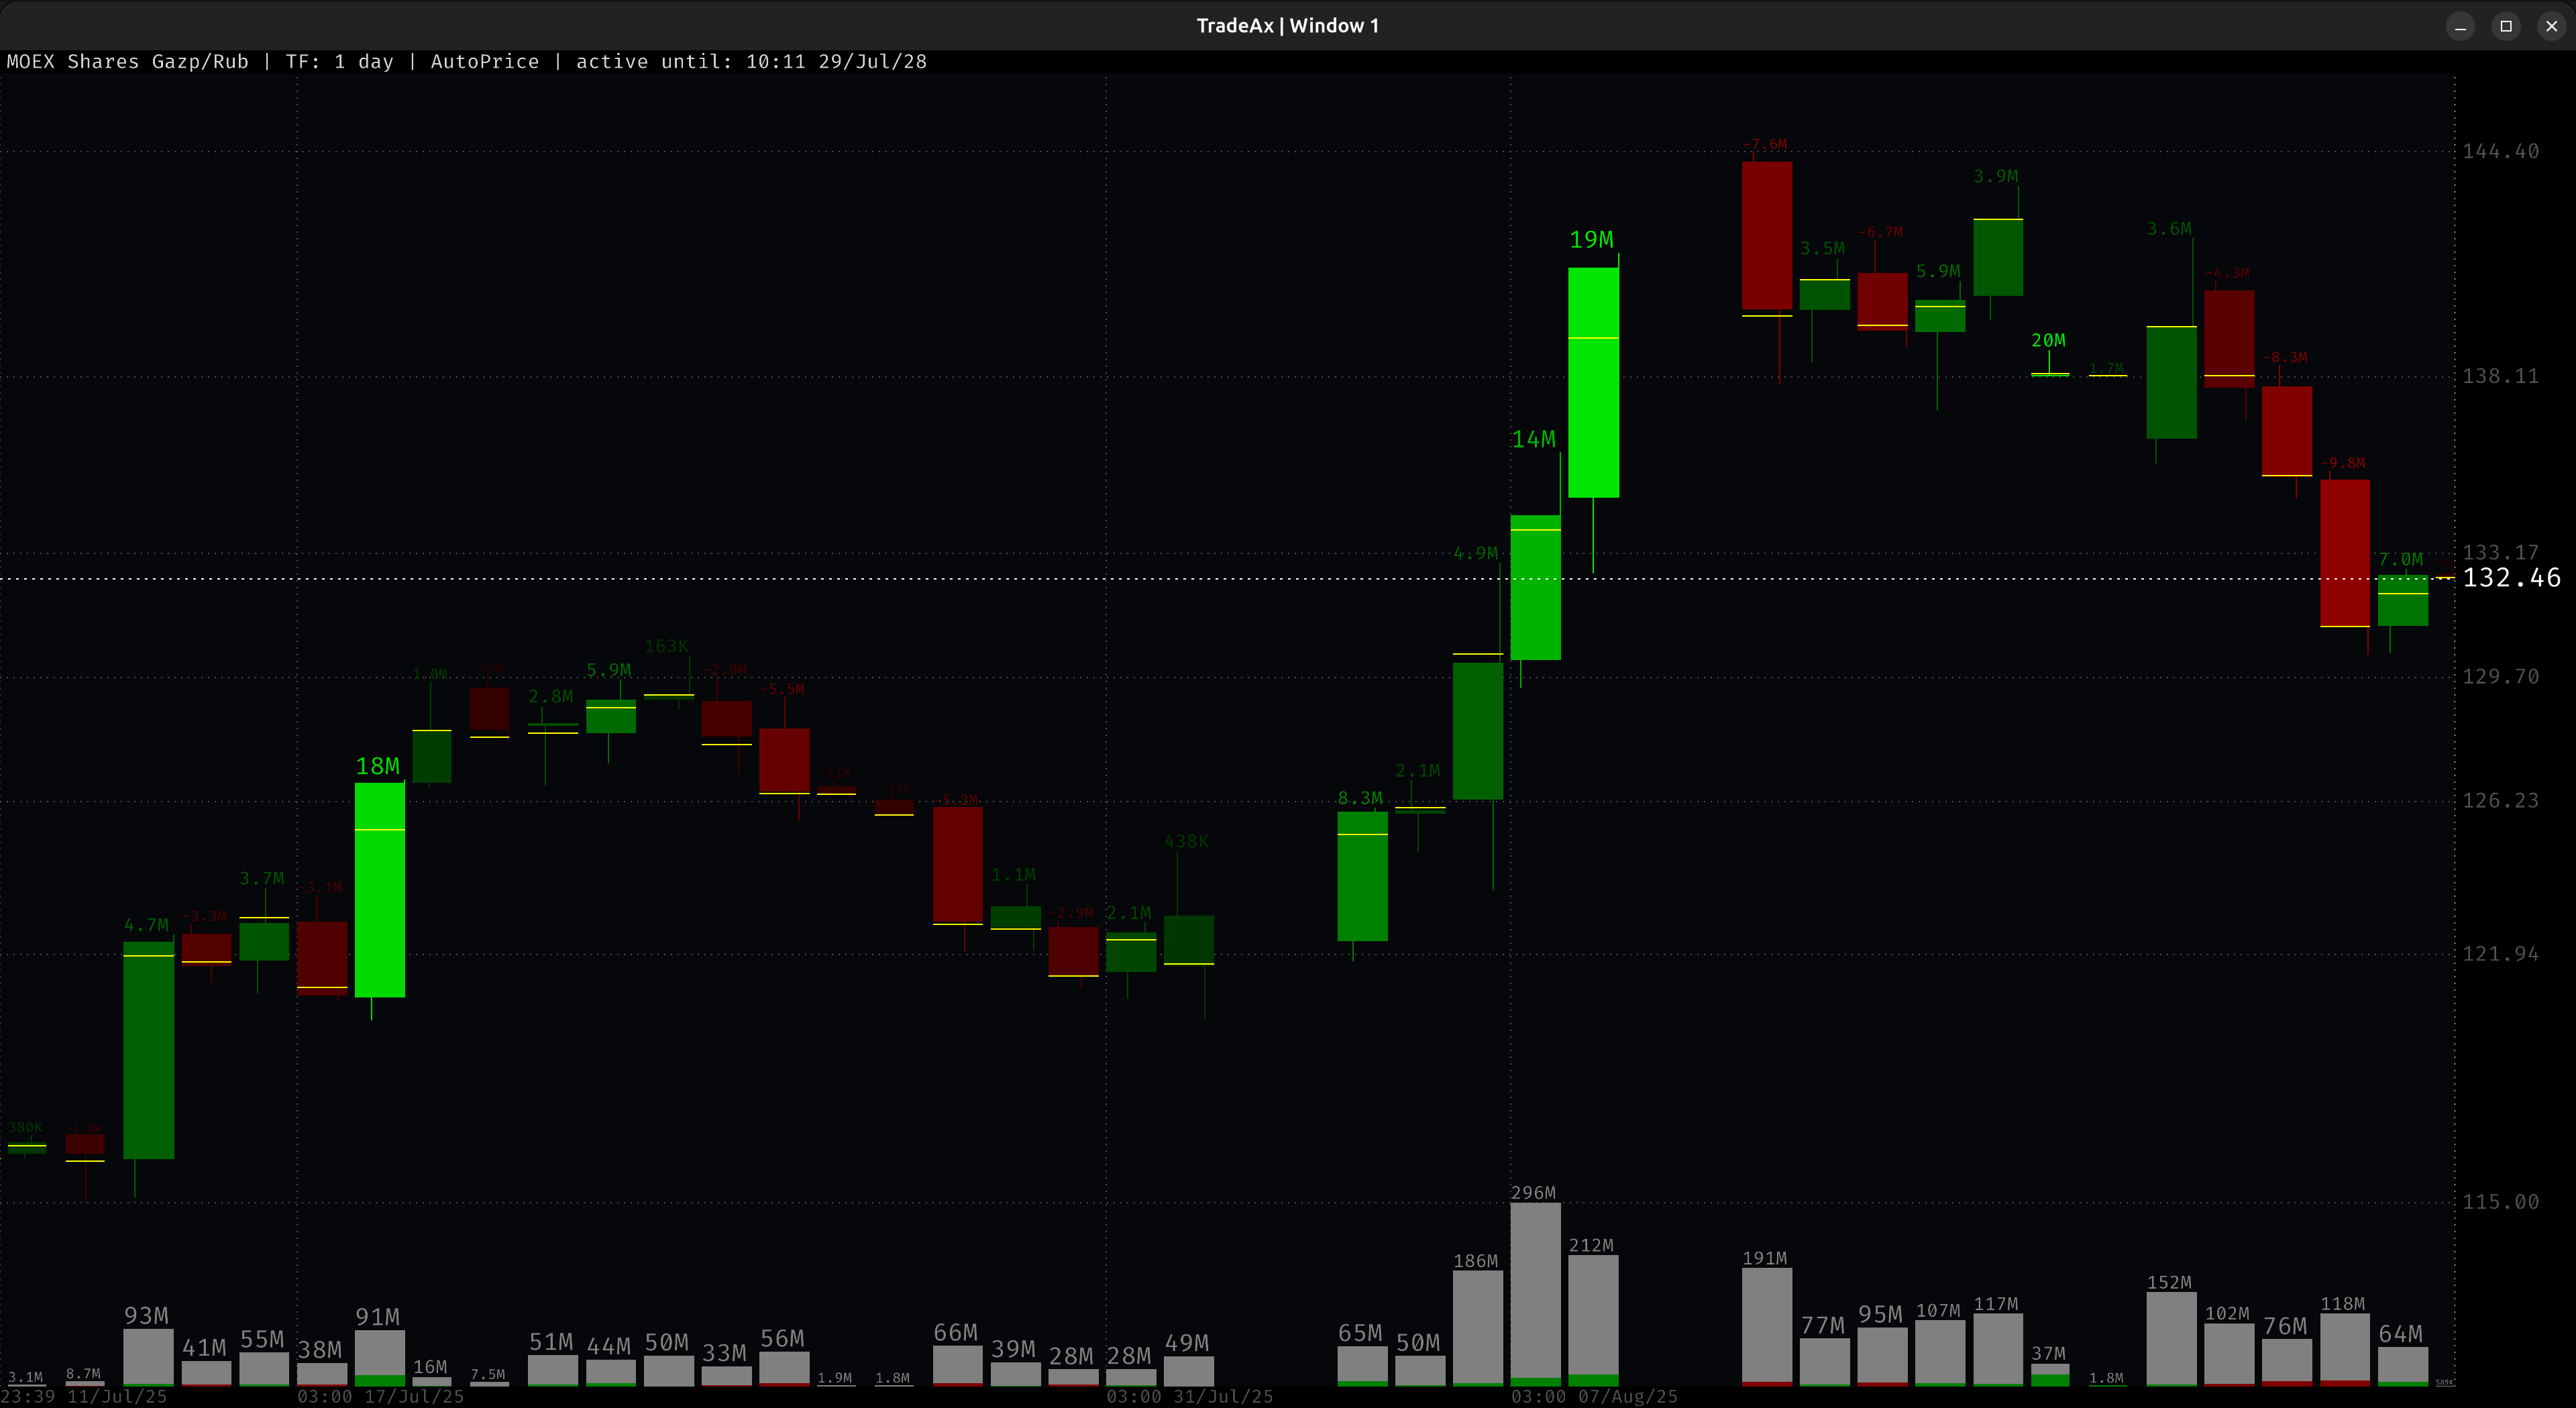
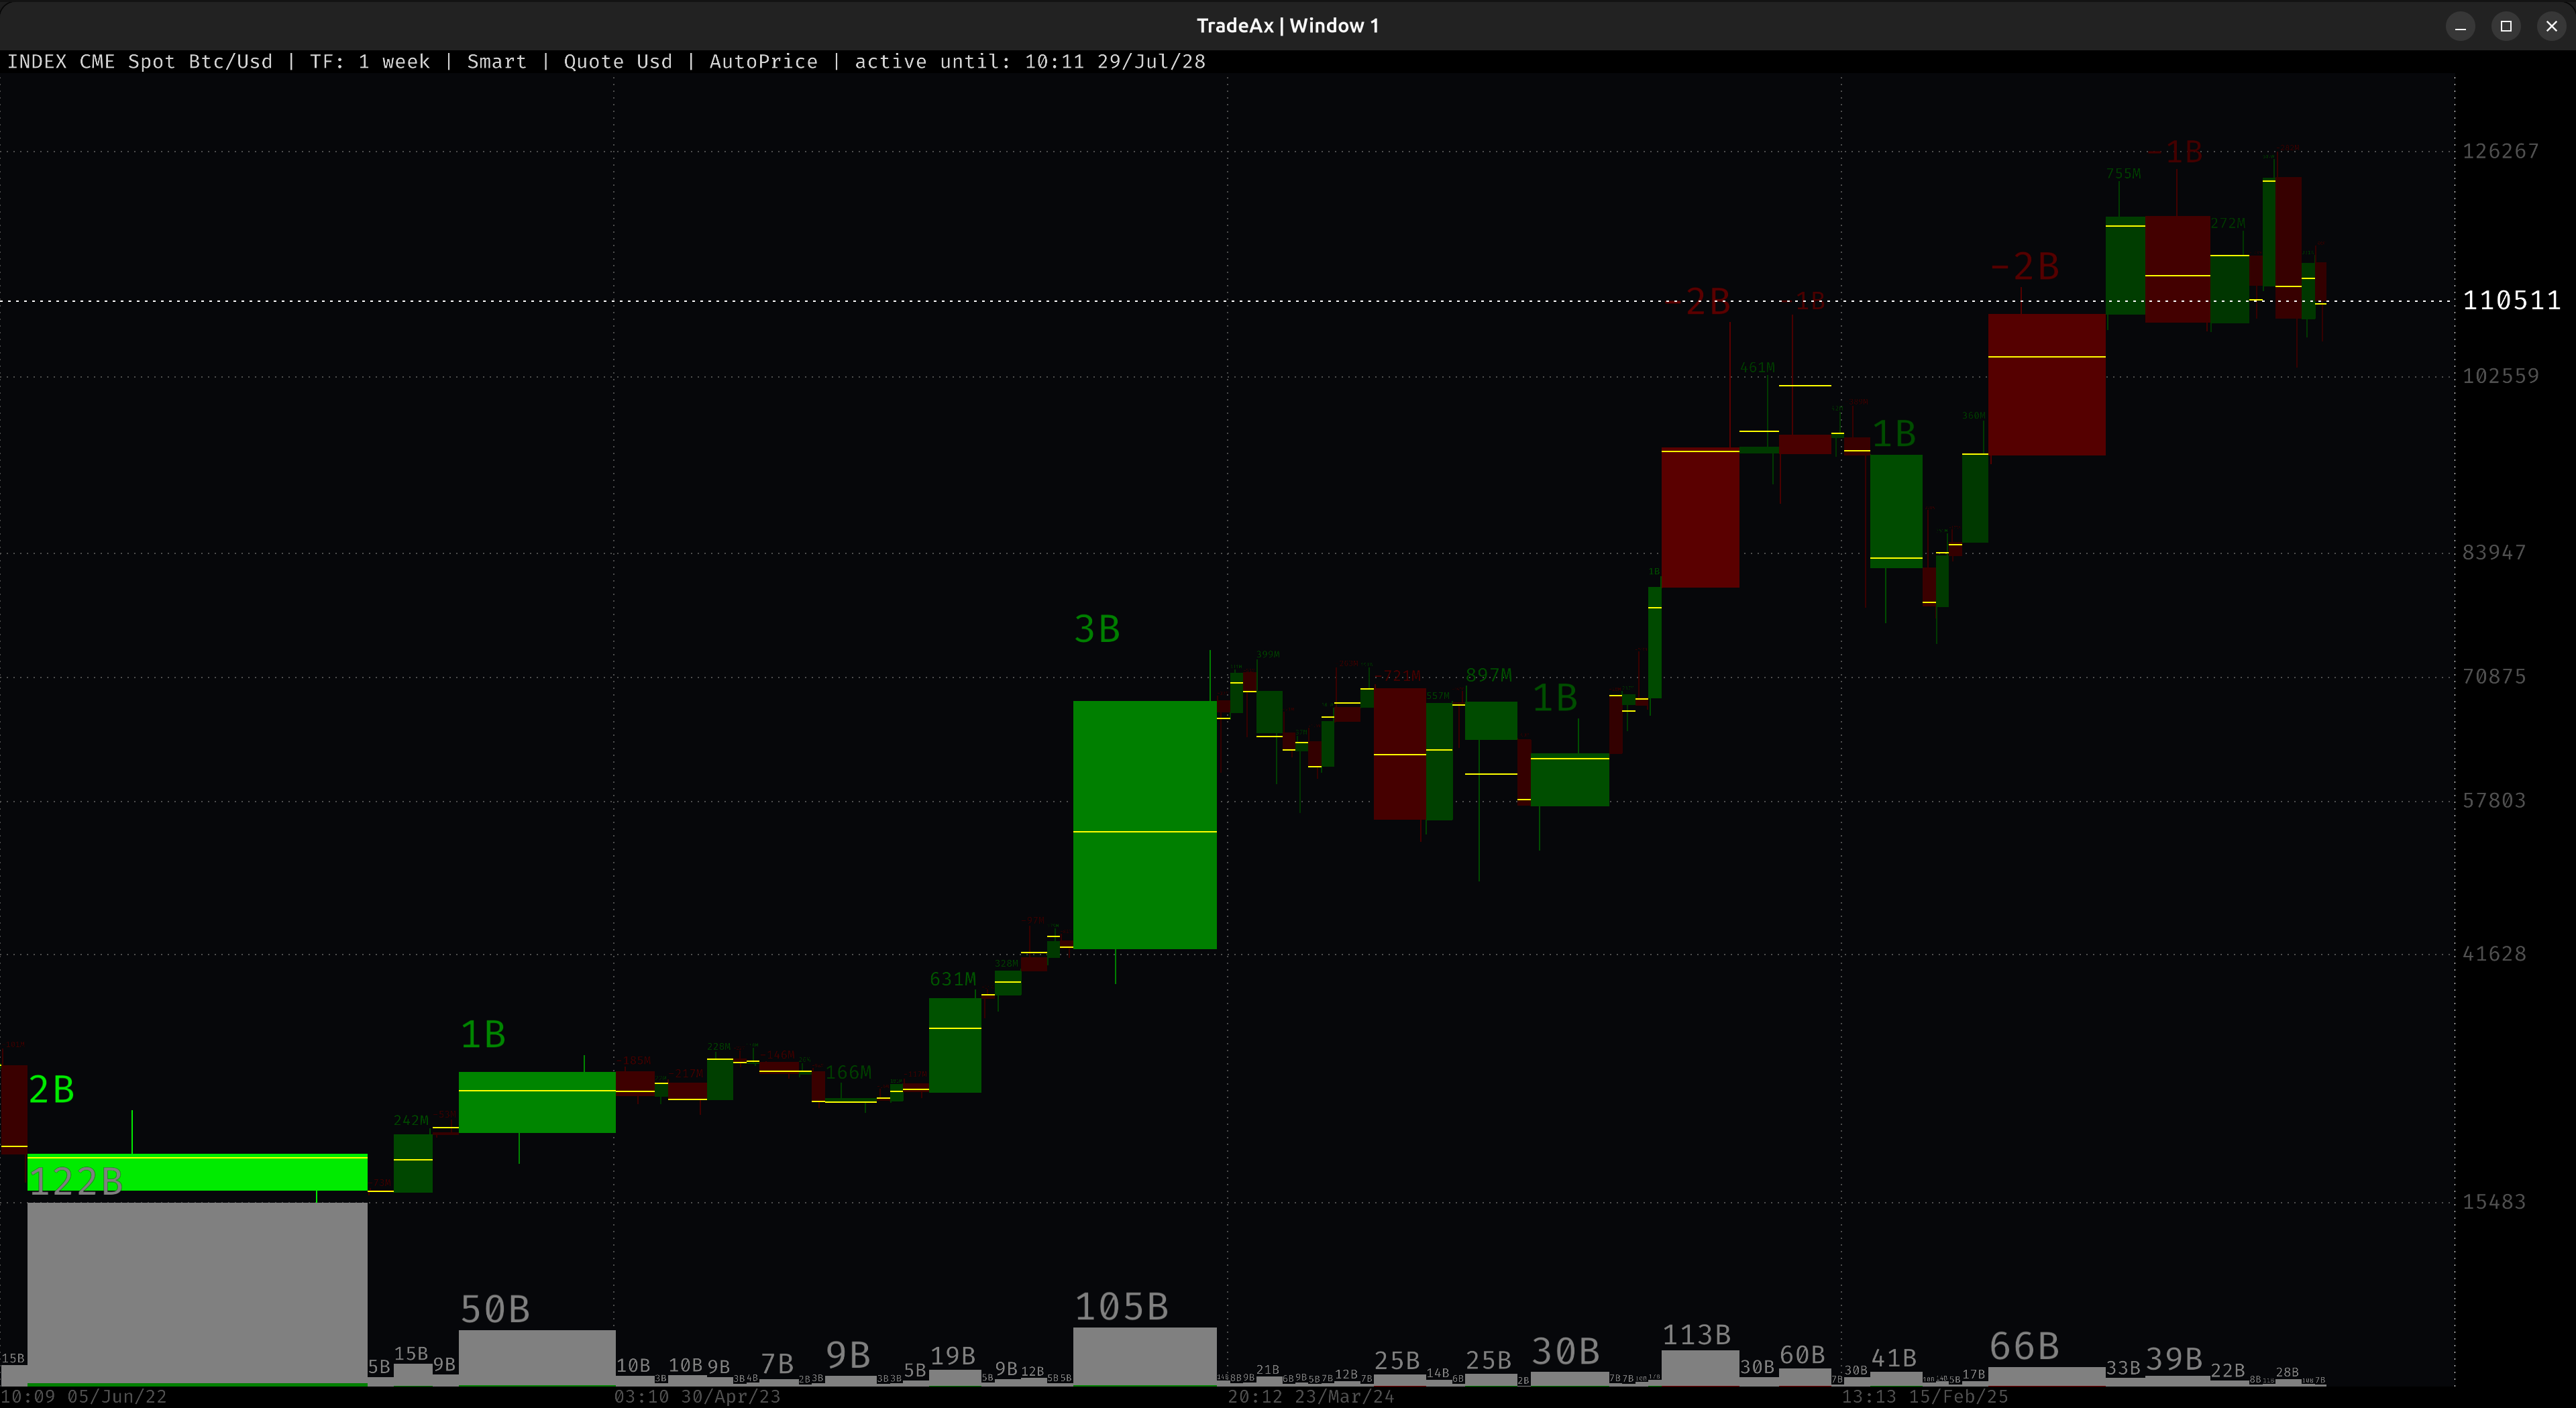
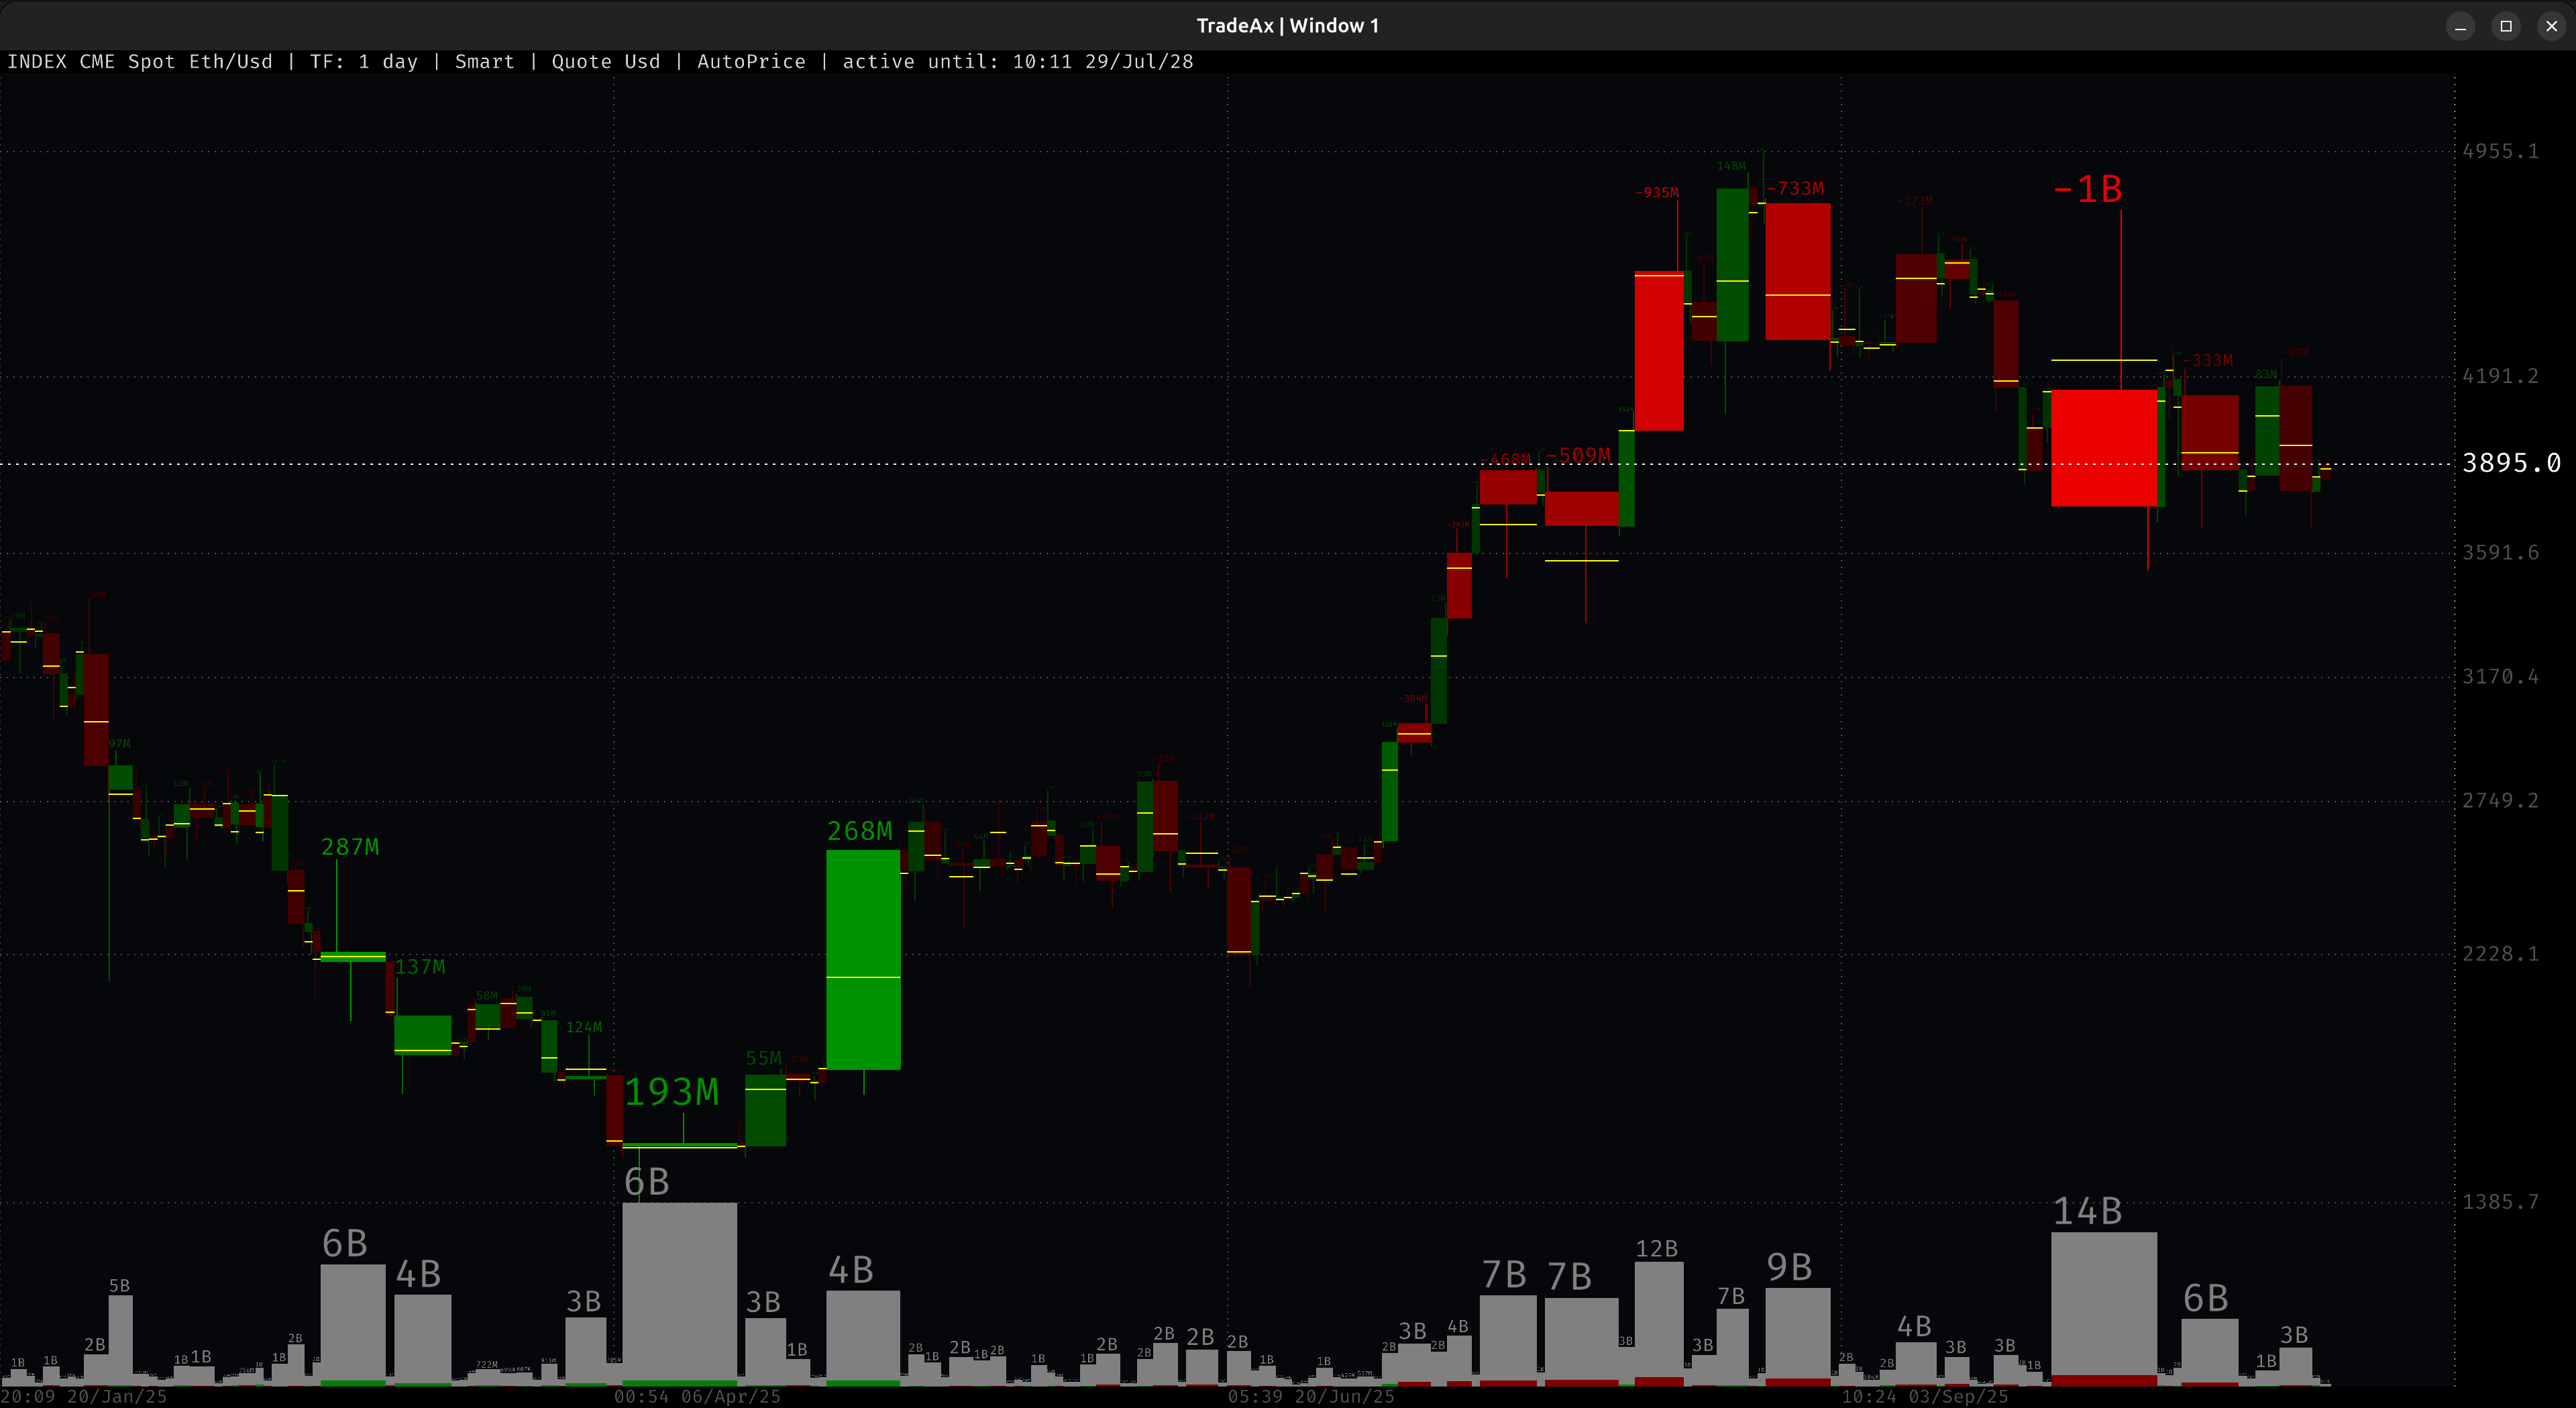
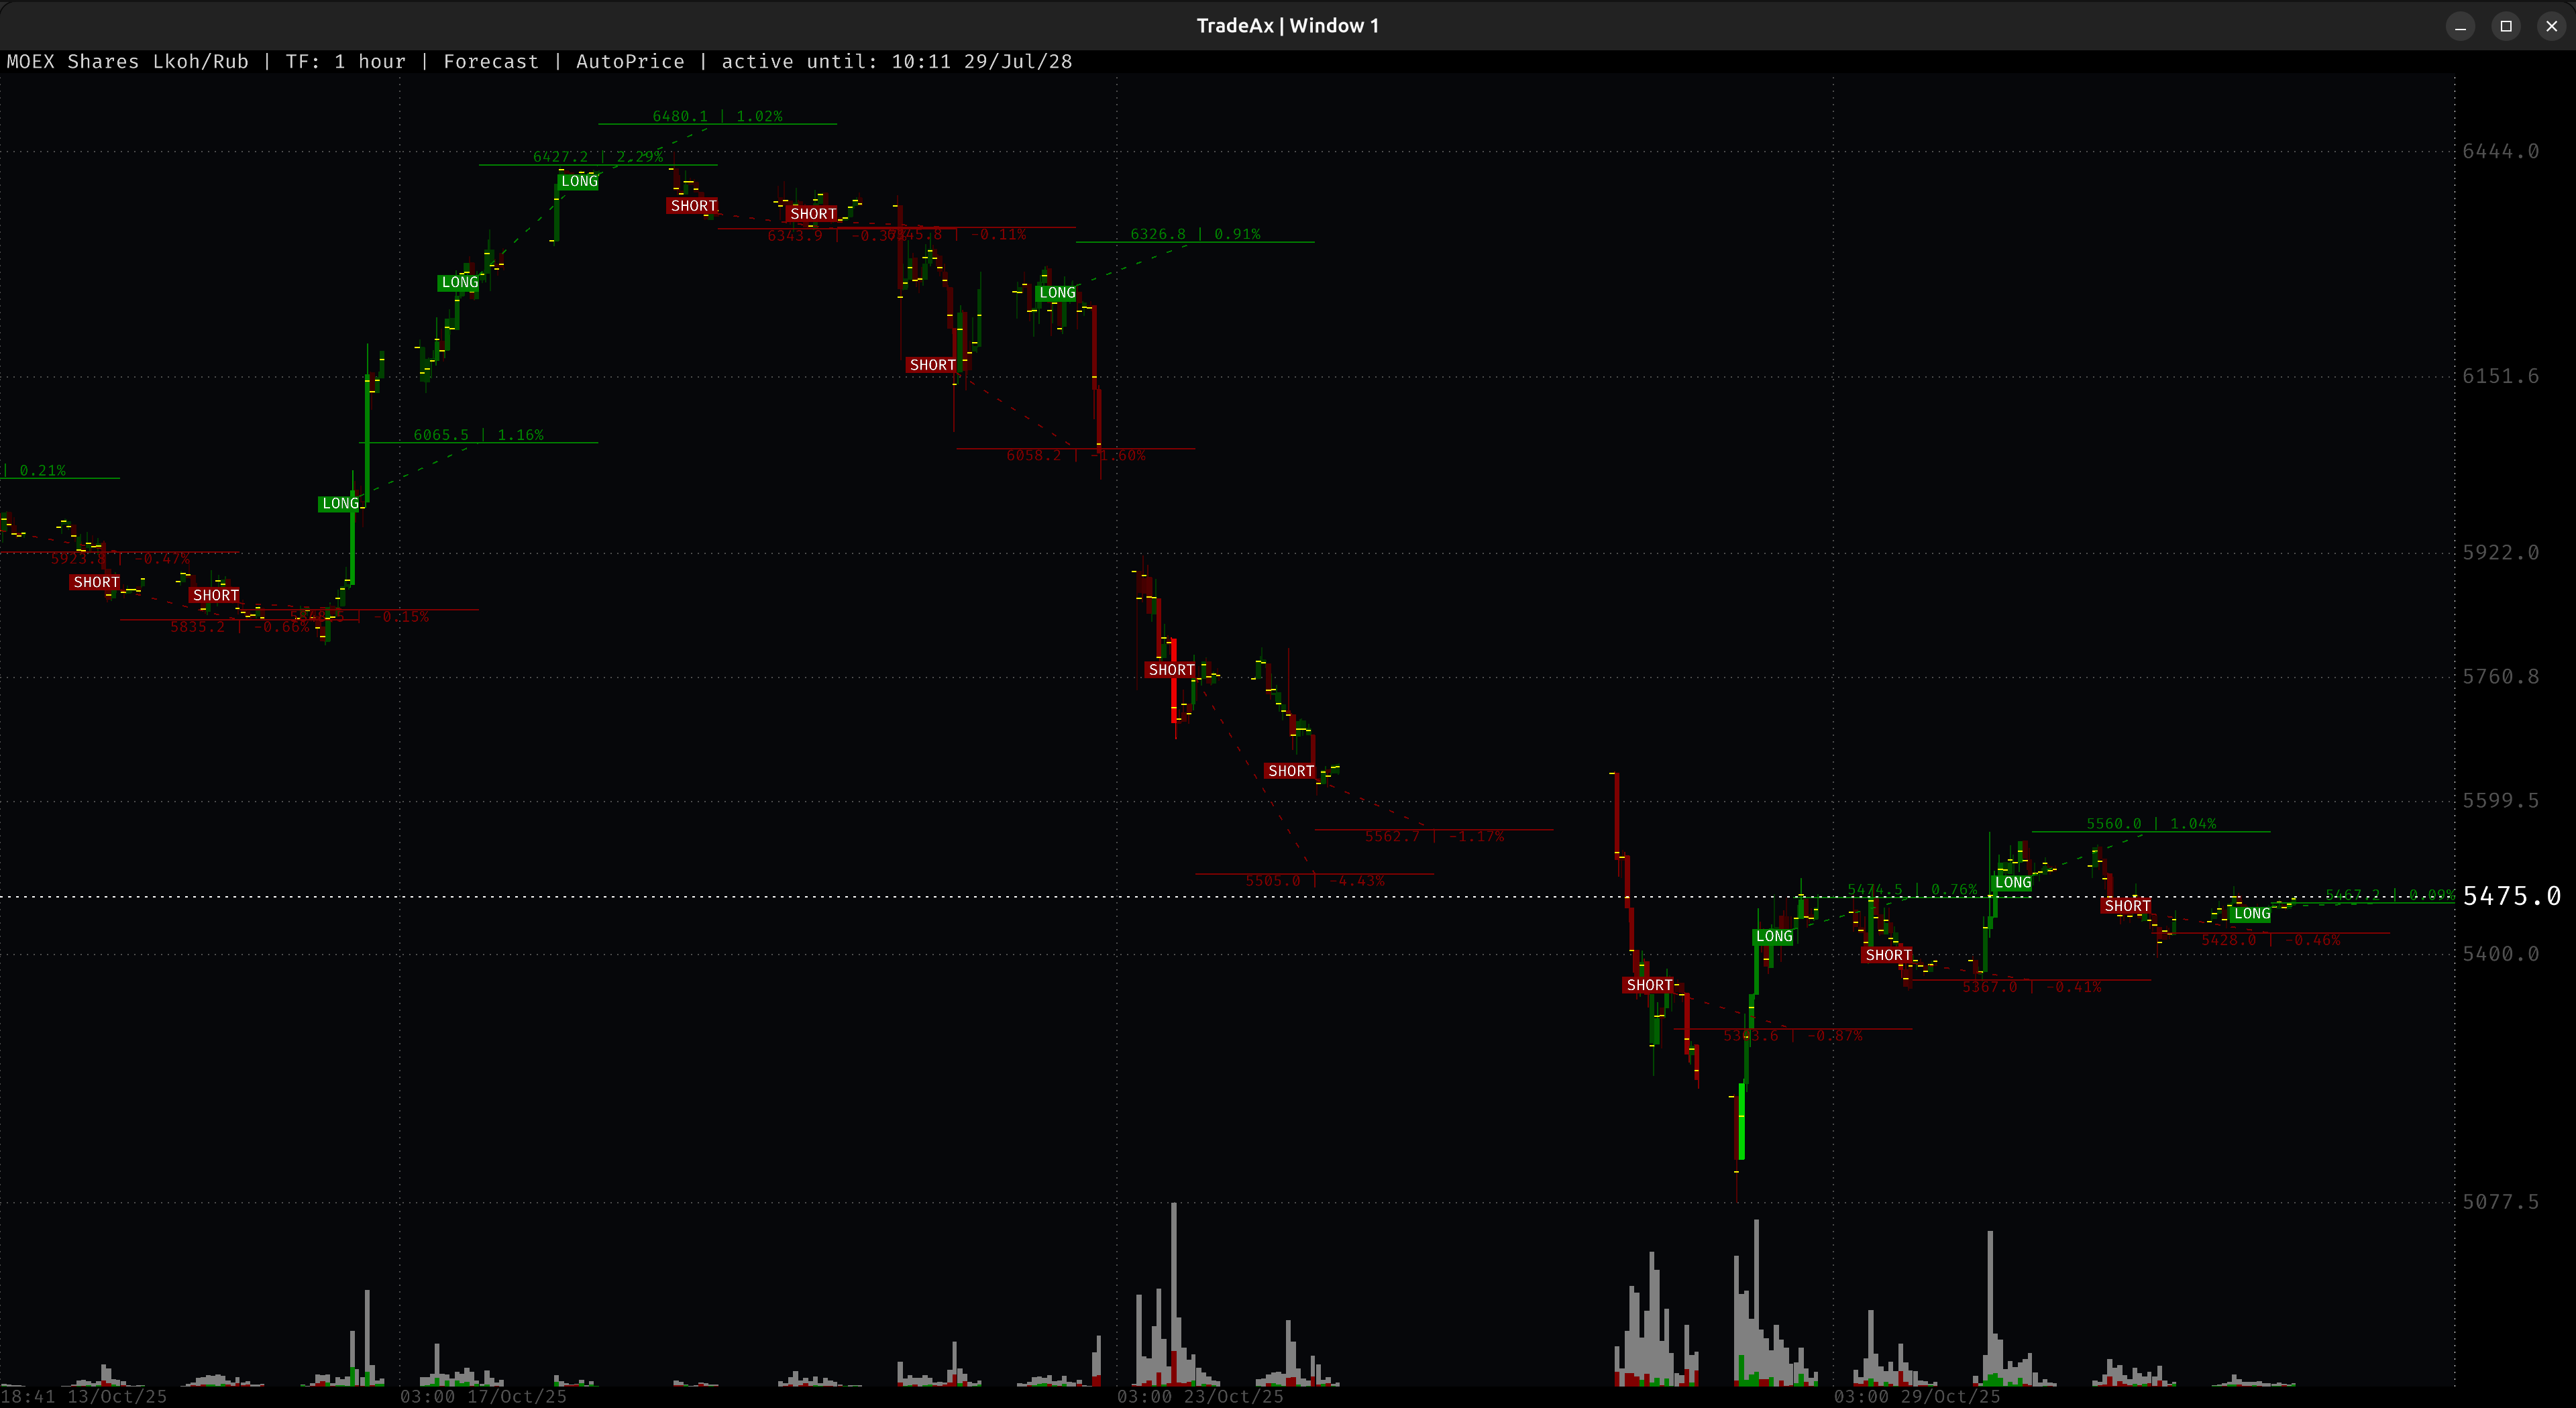
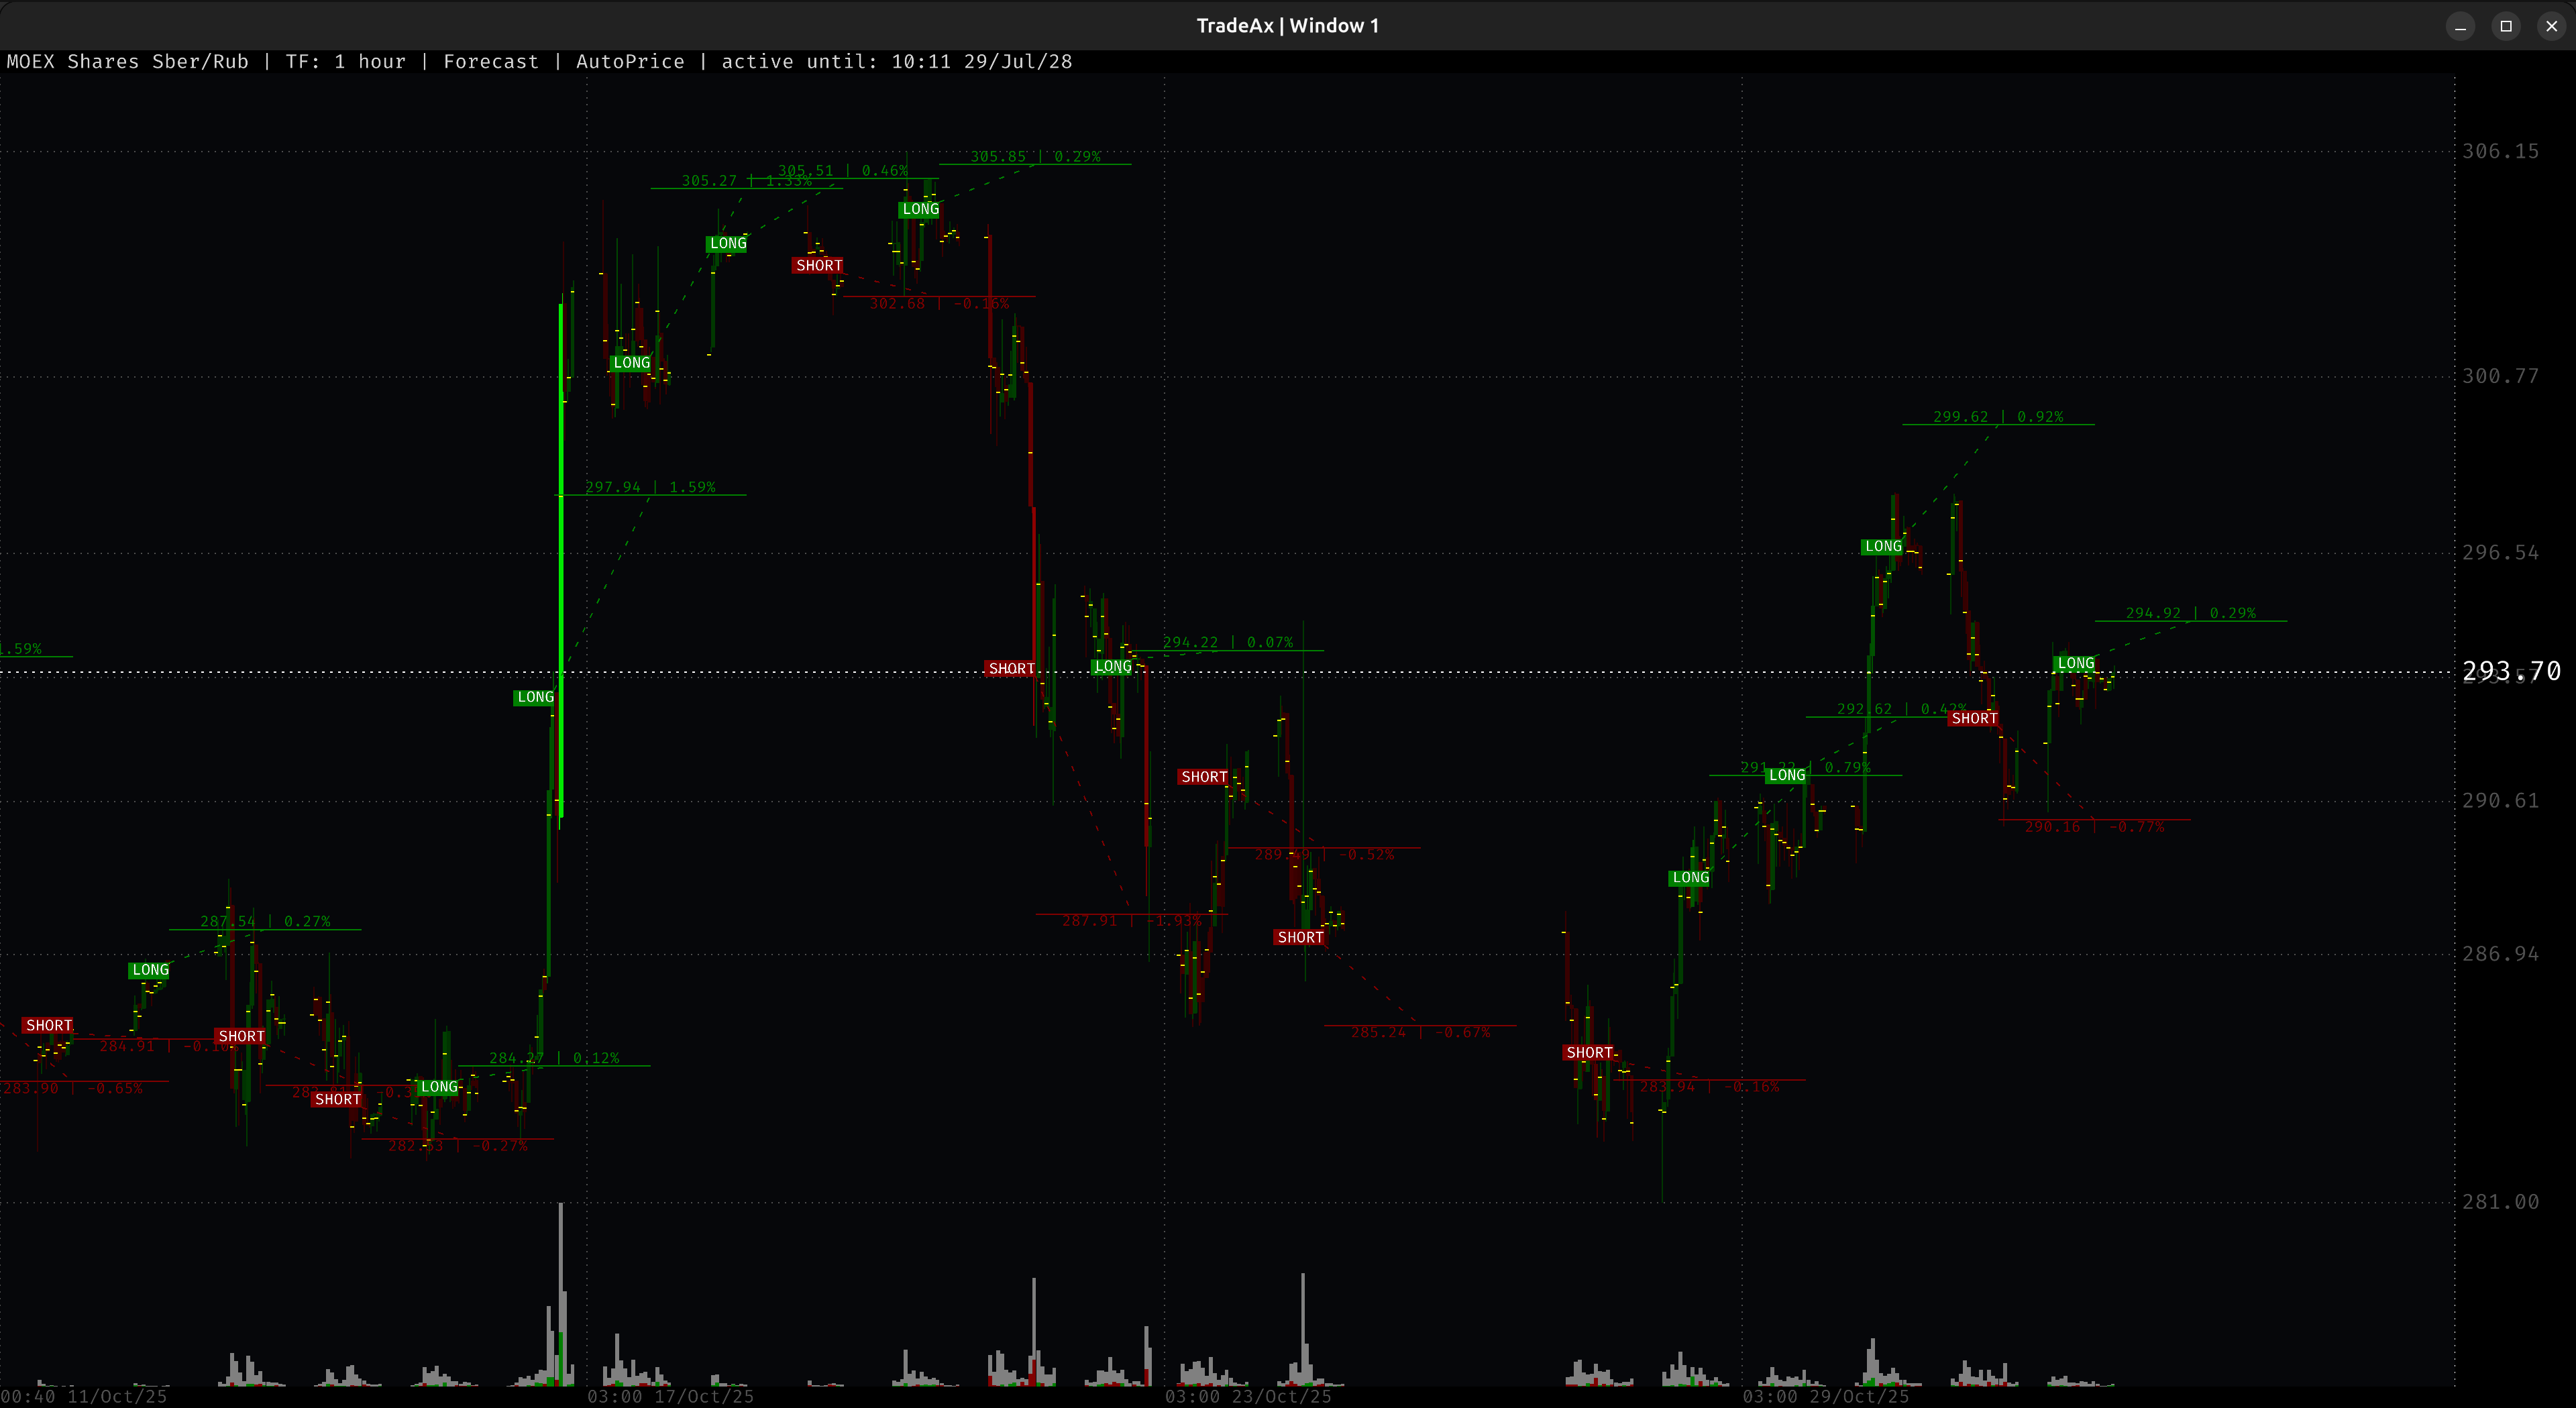
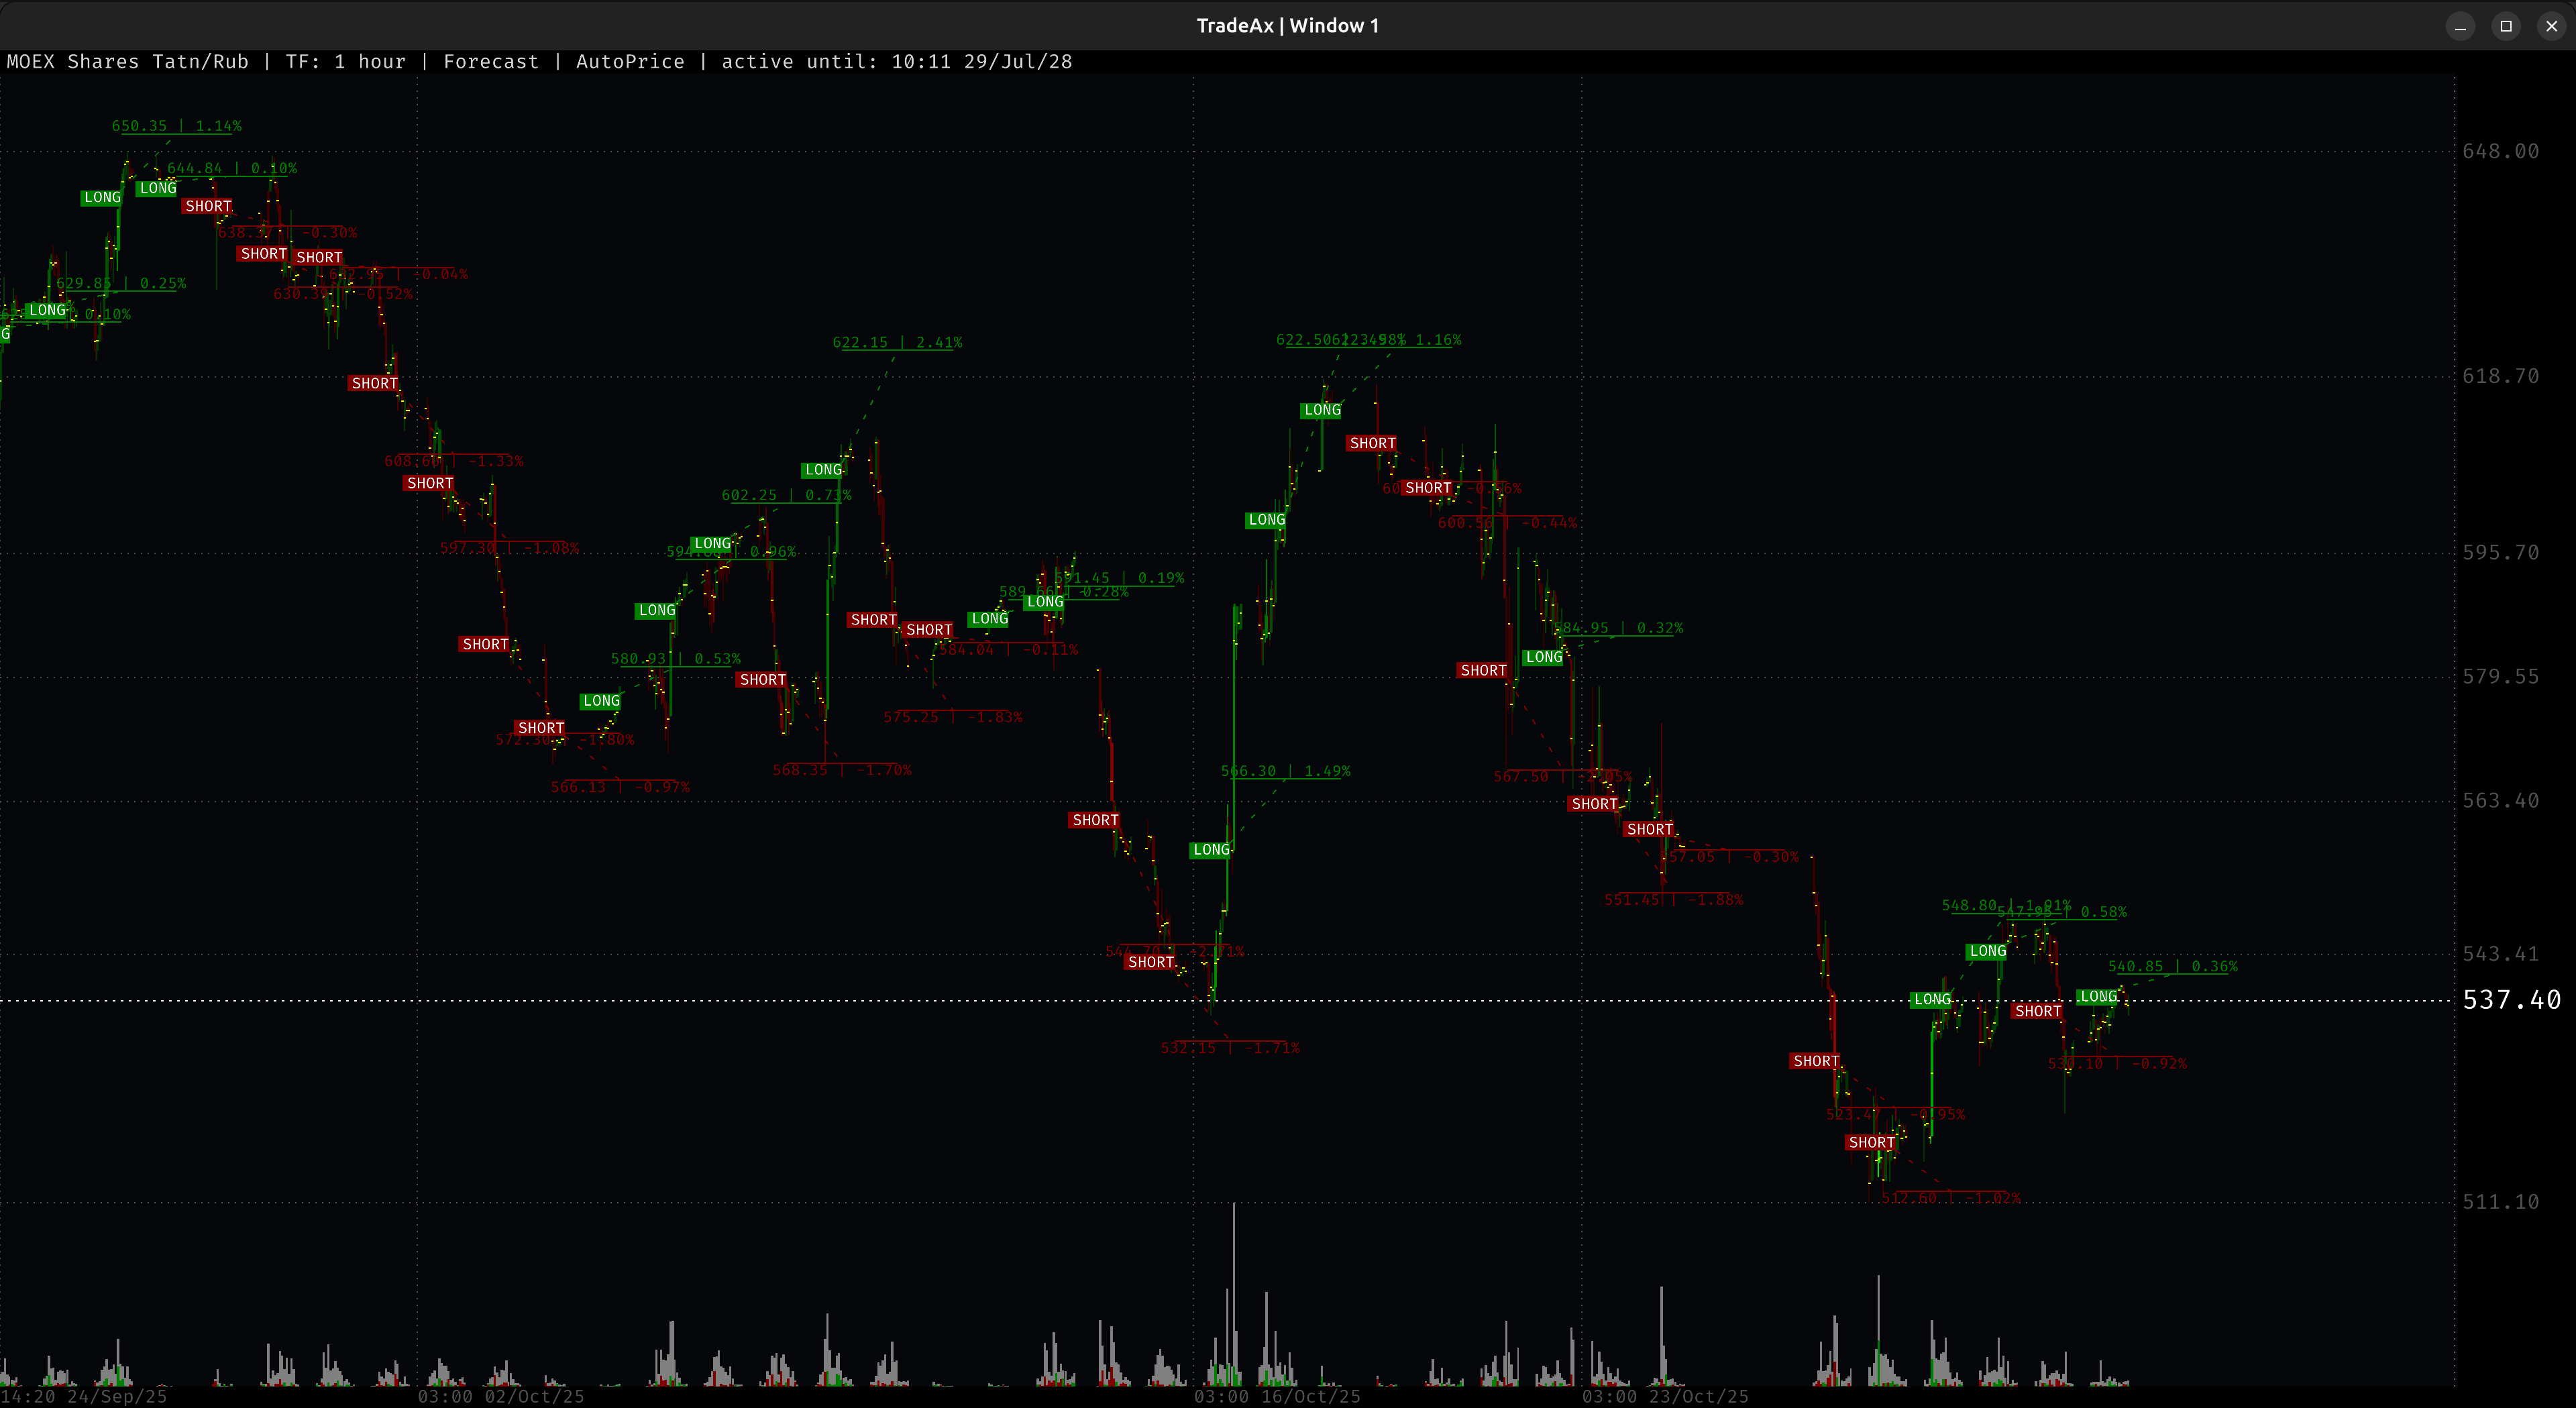
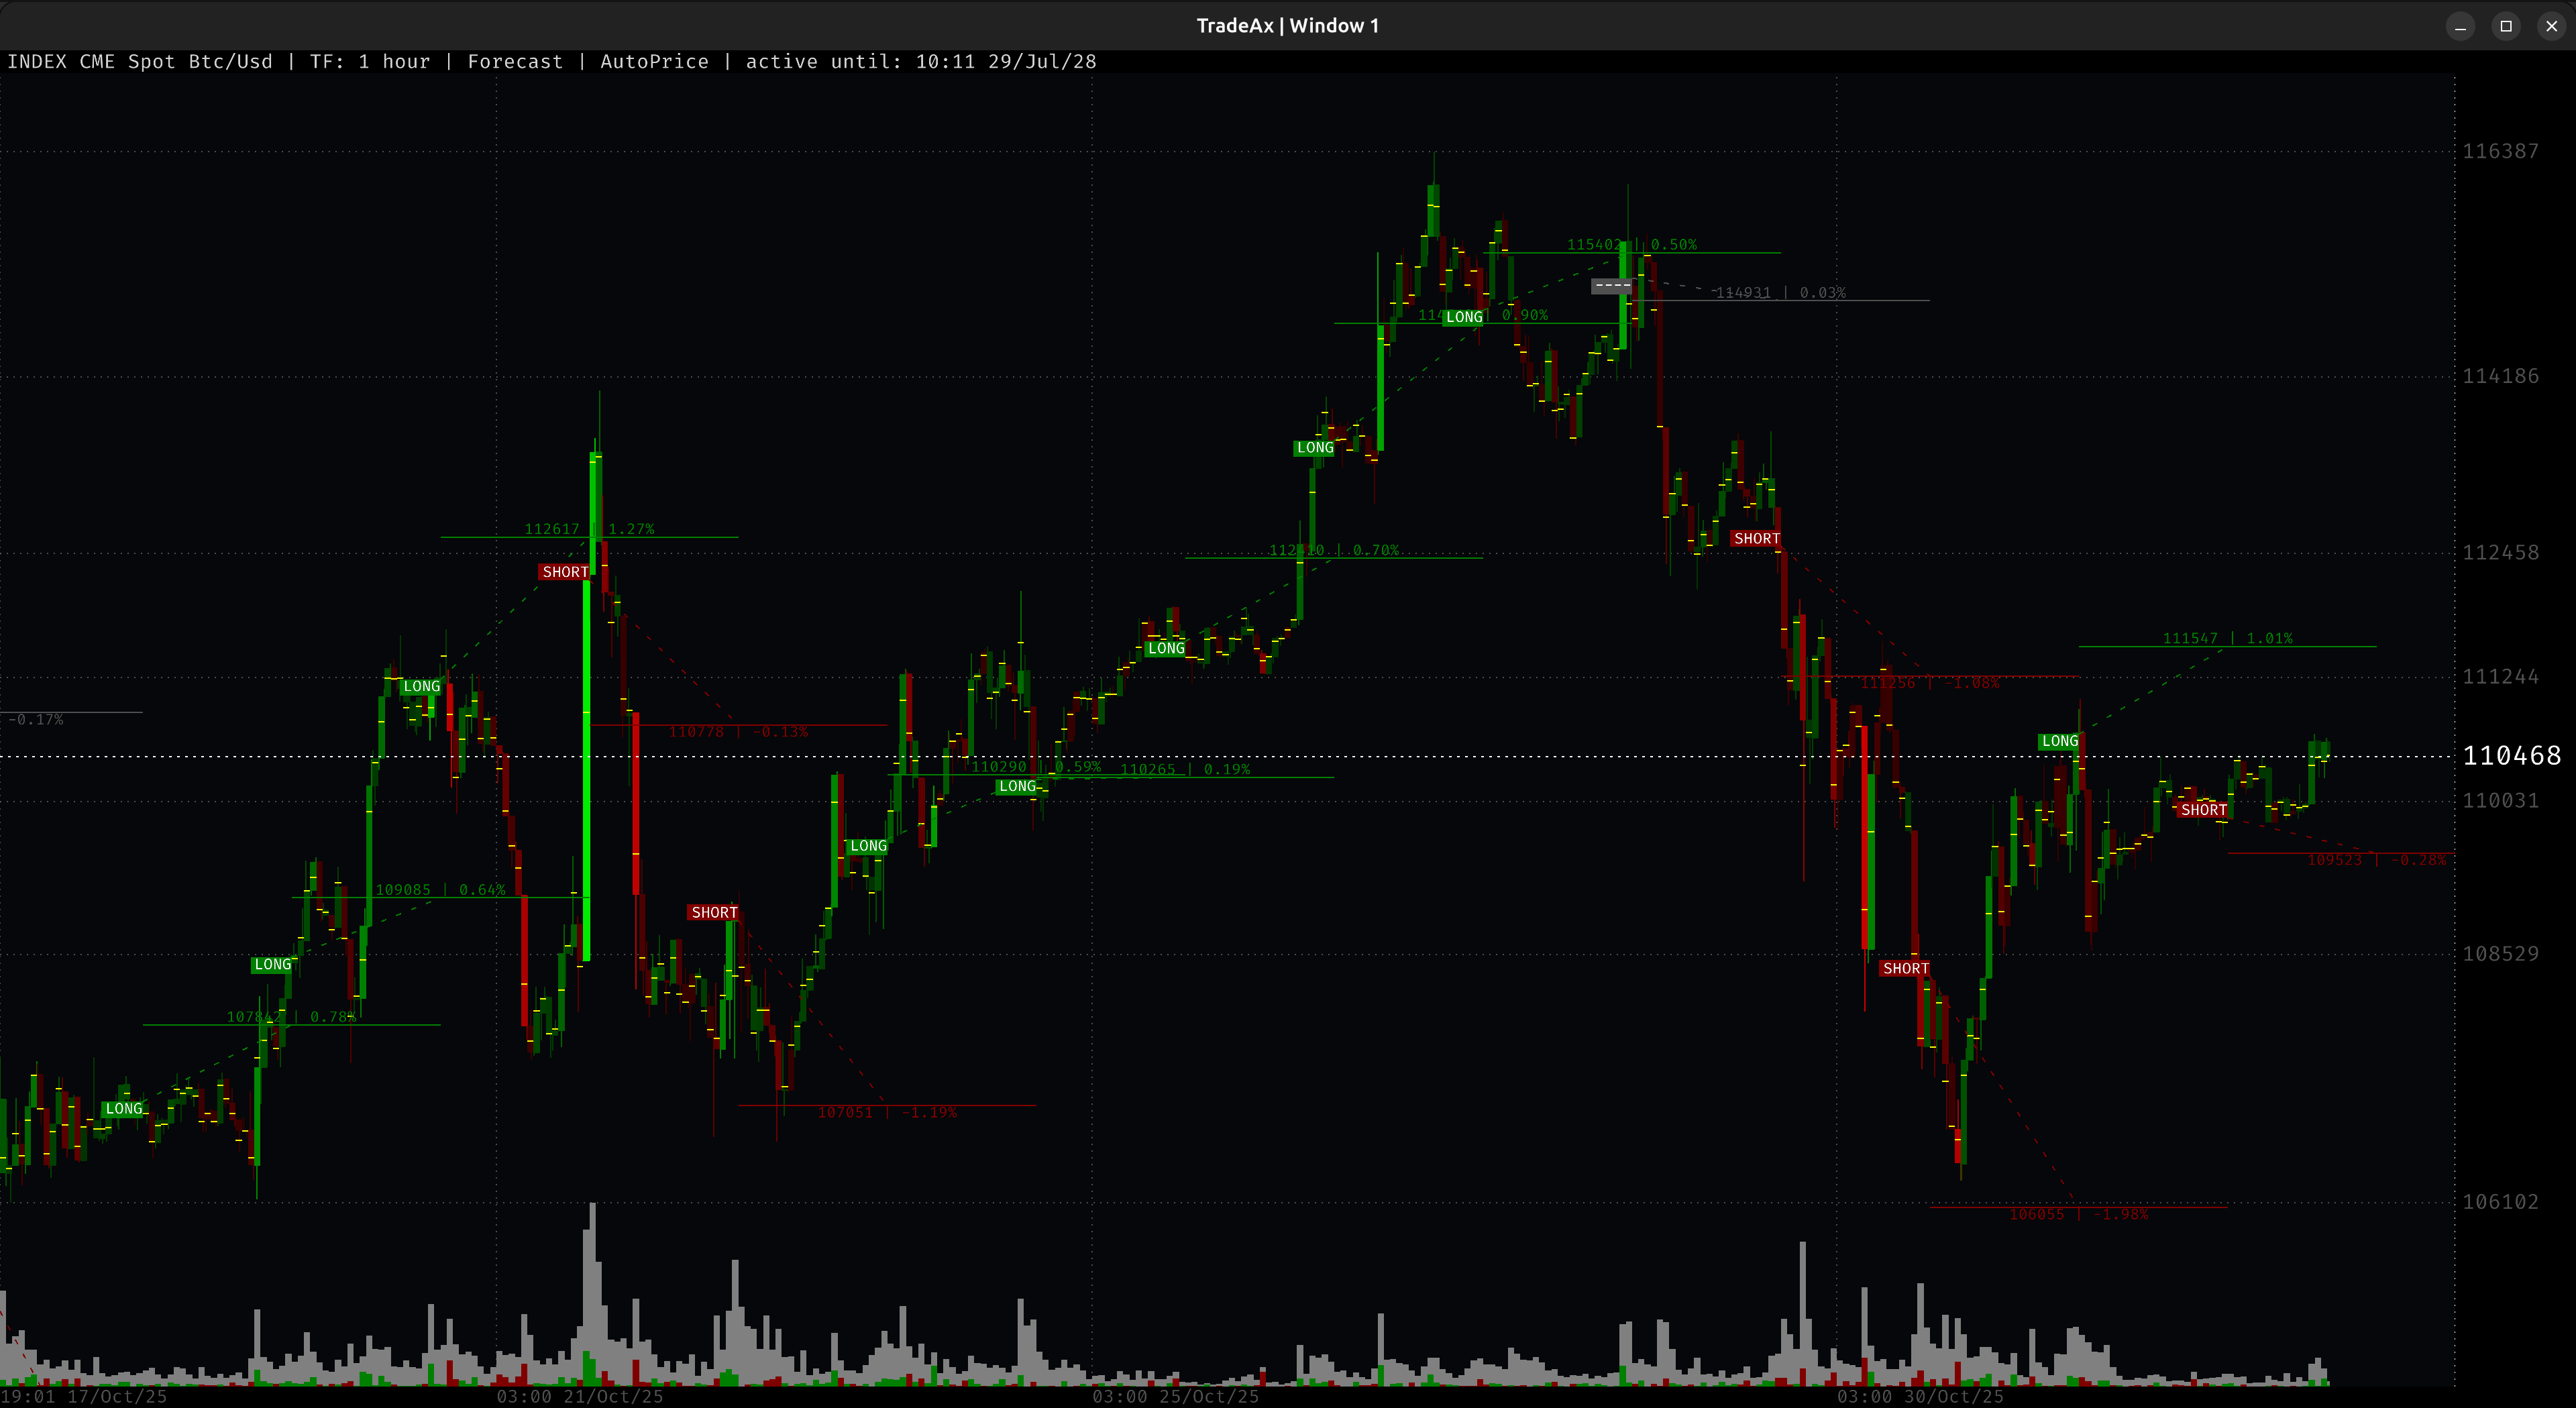
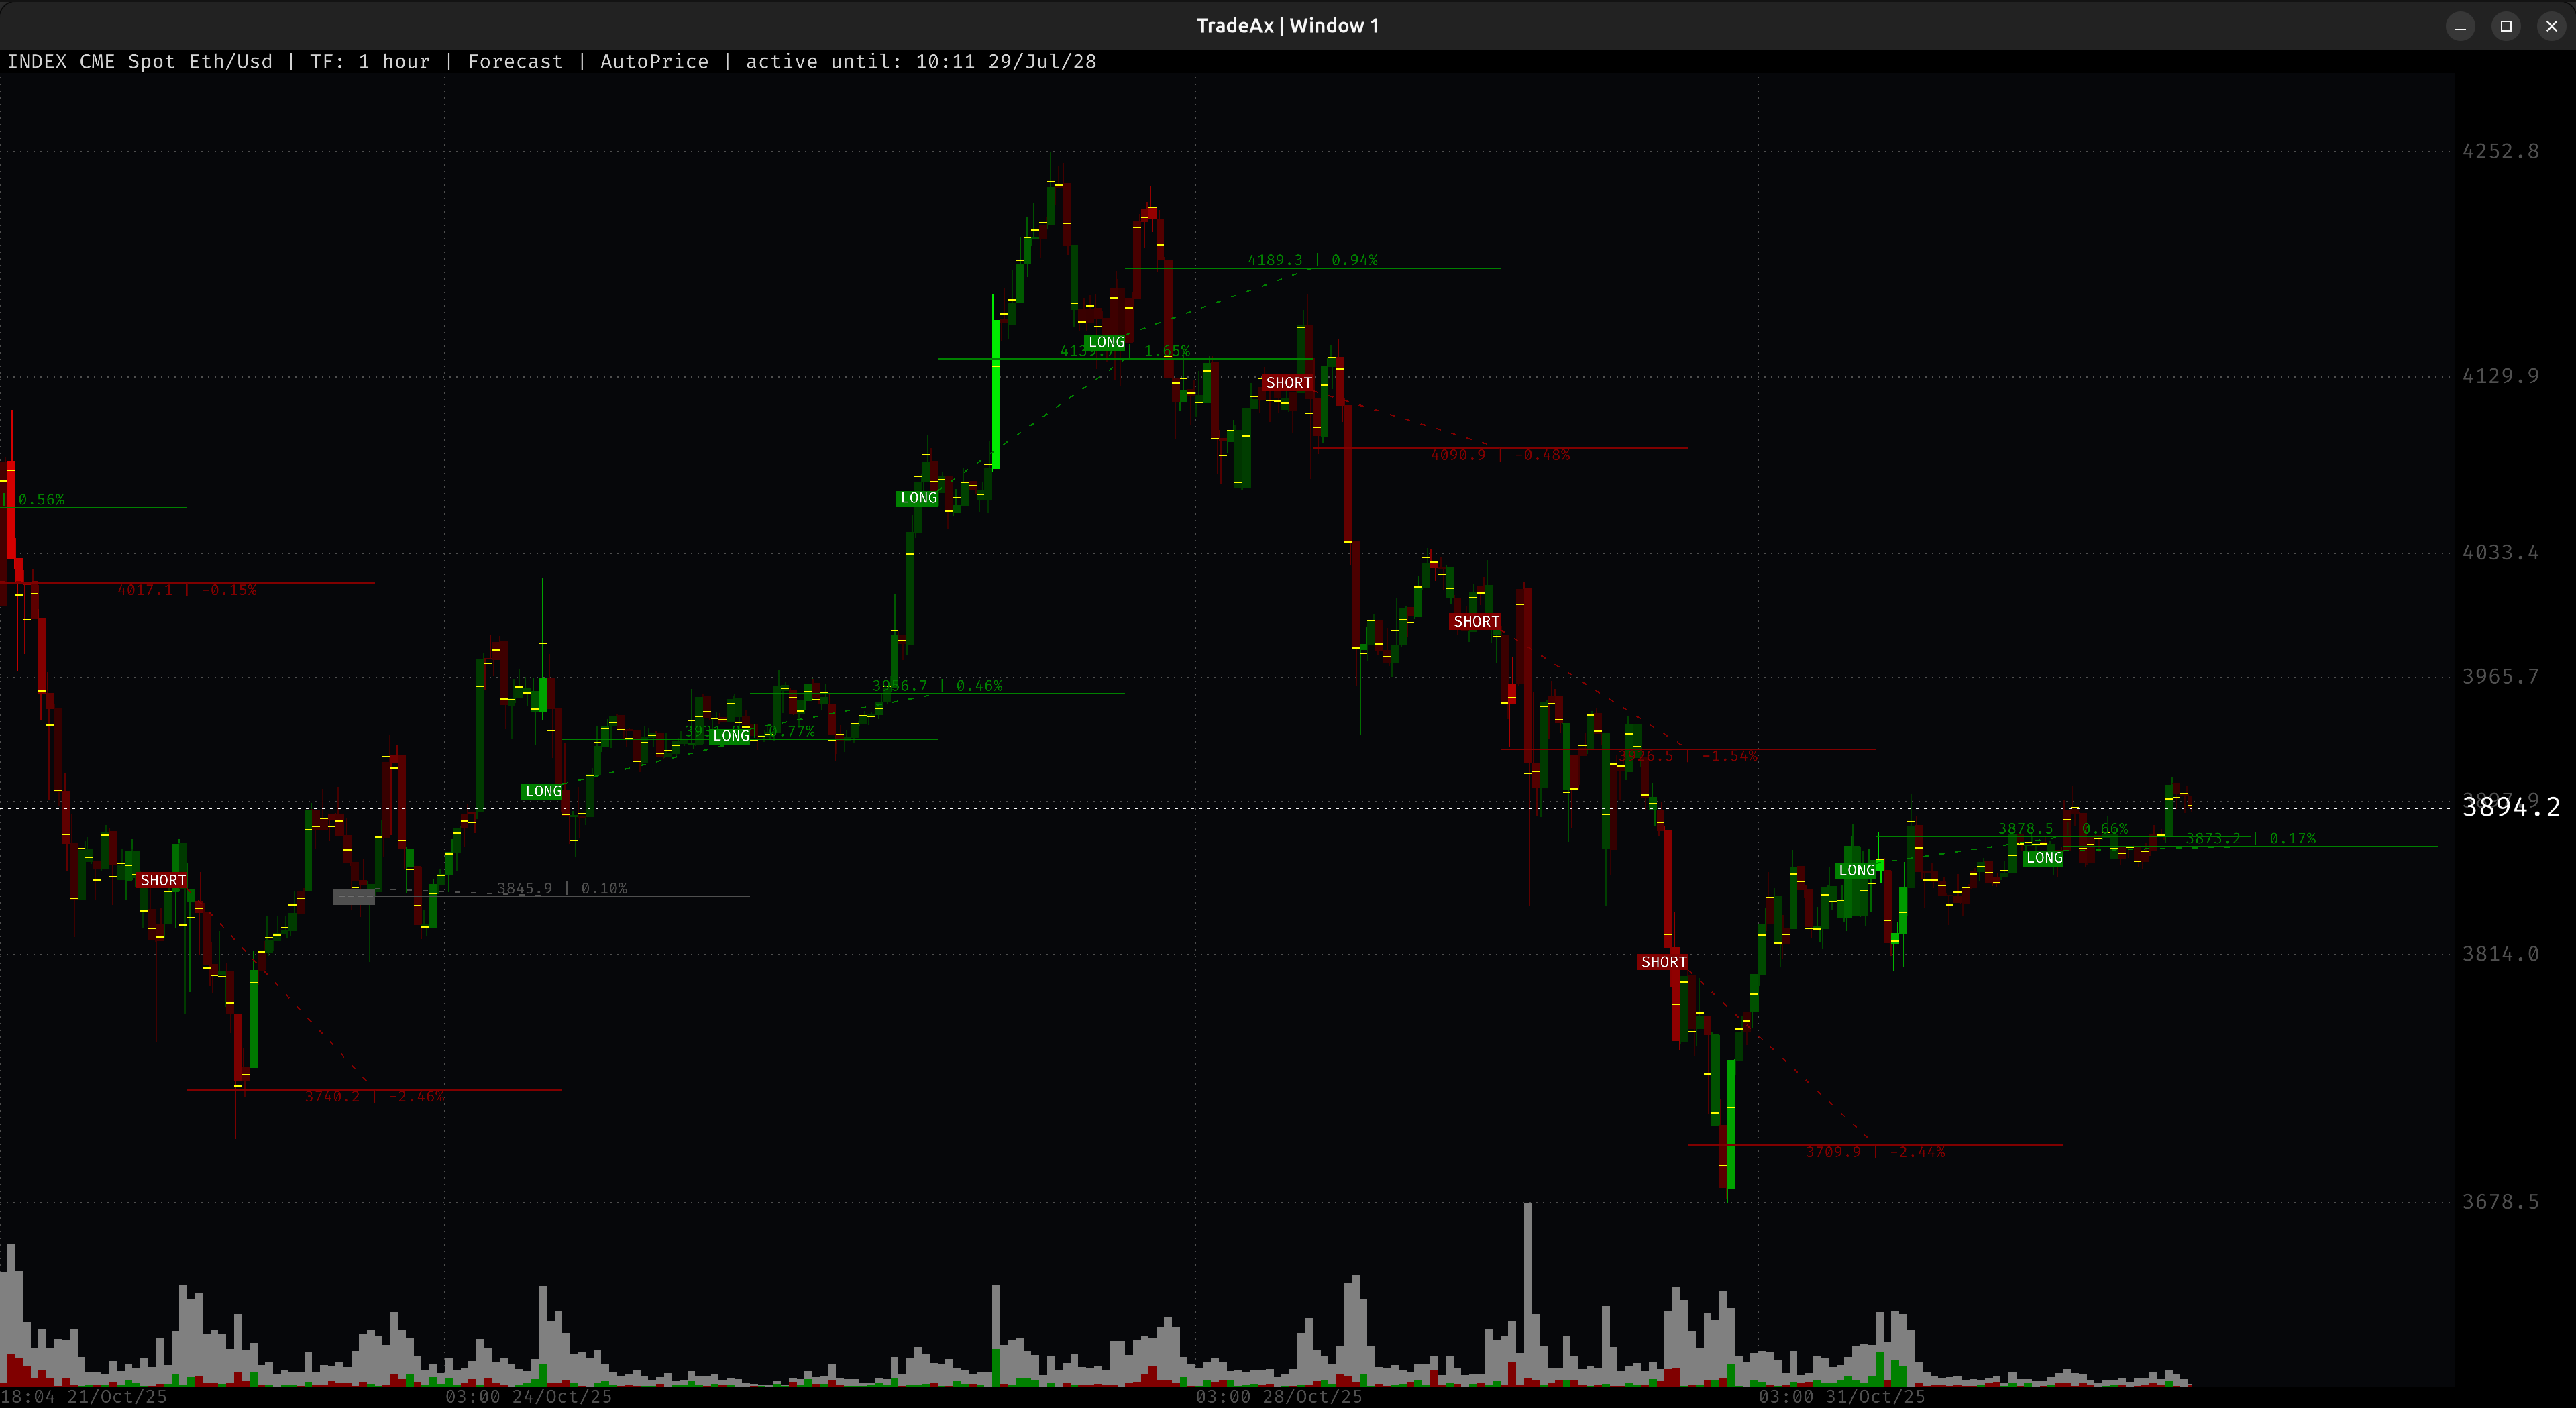
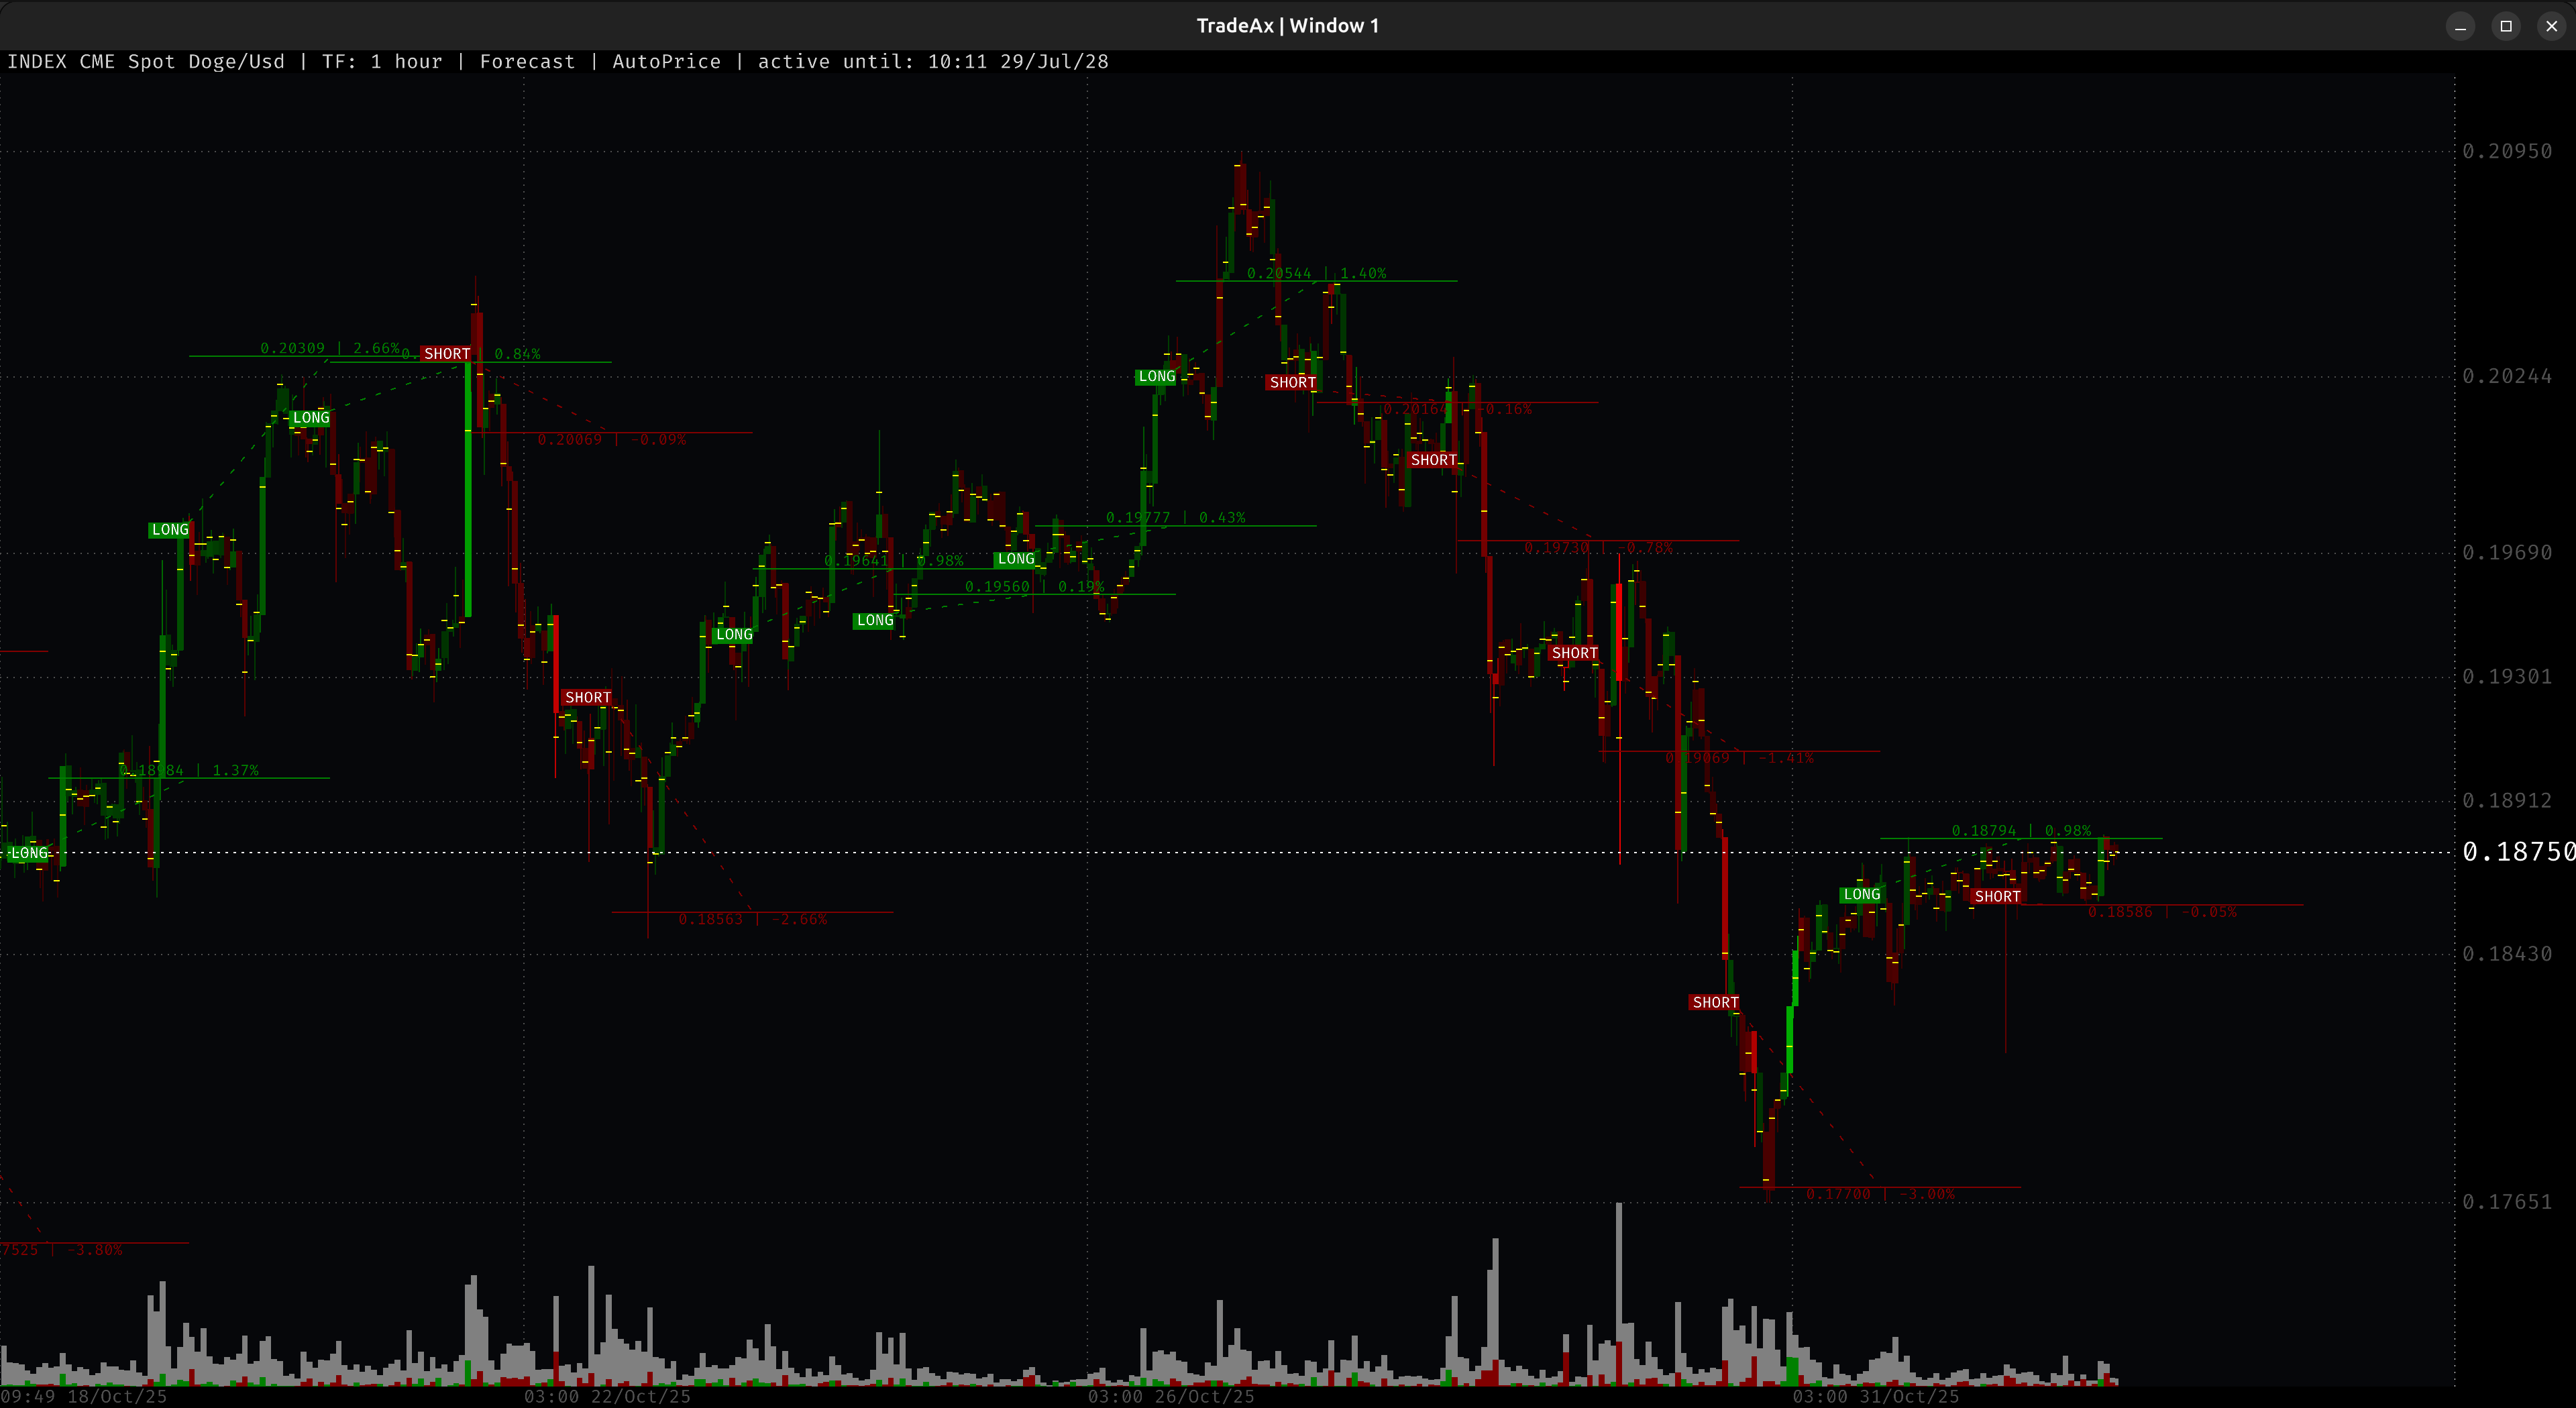
🎯 2. FORECAST: РАСЧЕТ ЦЕЛЕЙ ДВИЖЕНИЯ
Модуль автоматически вычисляет потенциальные цели, к которым крупный капитал/манипулятор может двигать цену. Это позволяет не гадать о намерениях "китов", а действовать на опережение, основываясь на математических моделях.
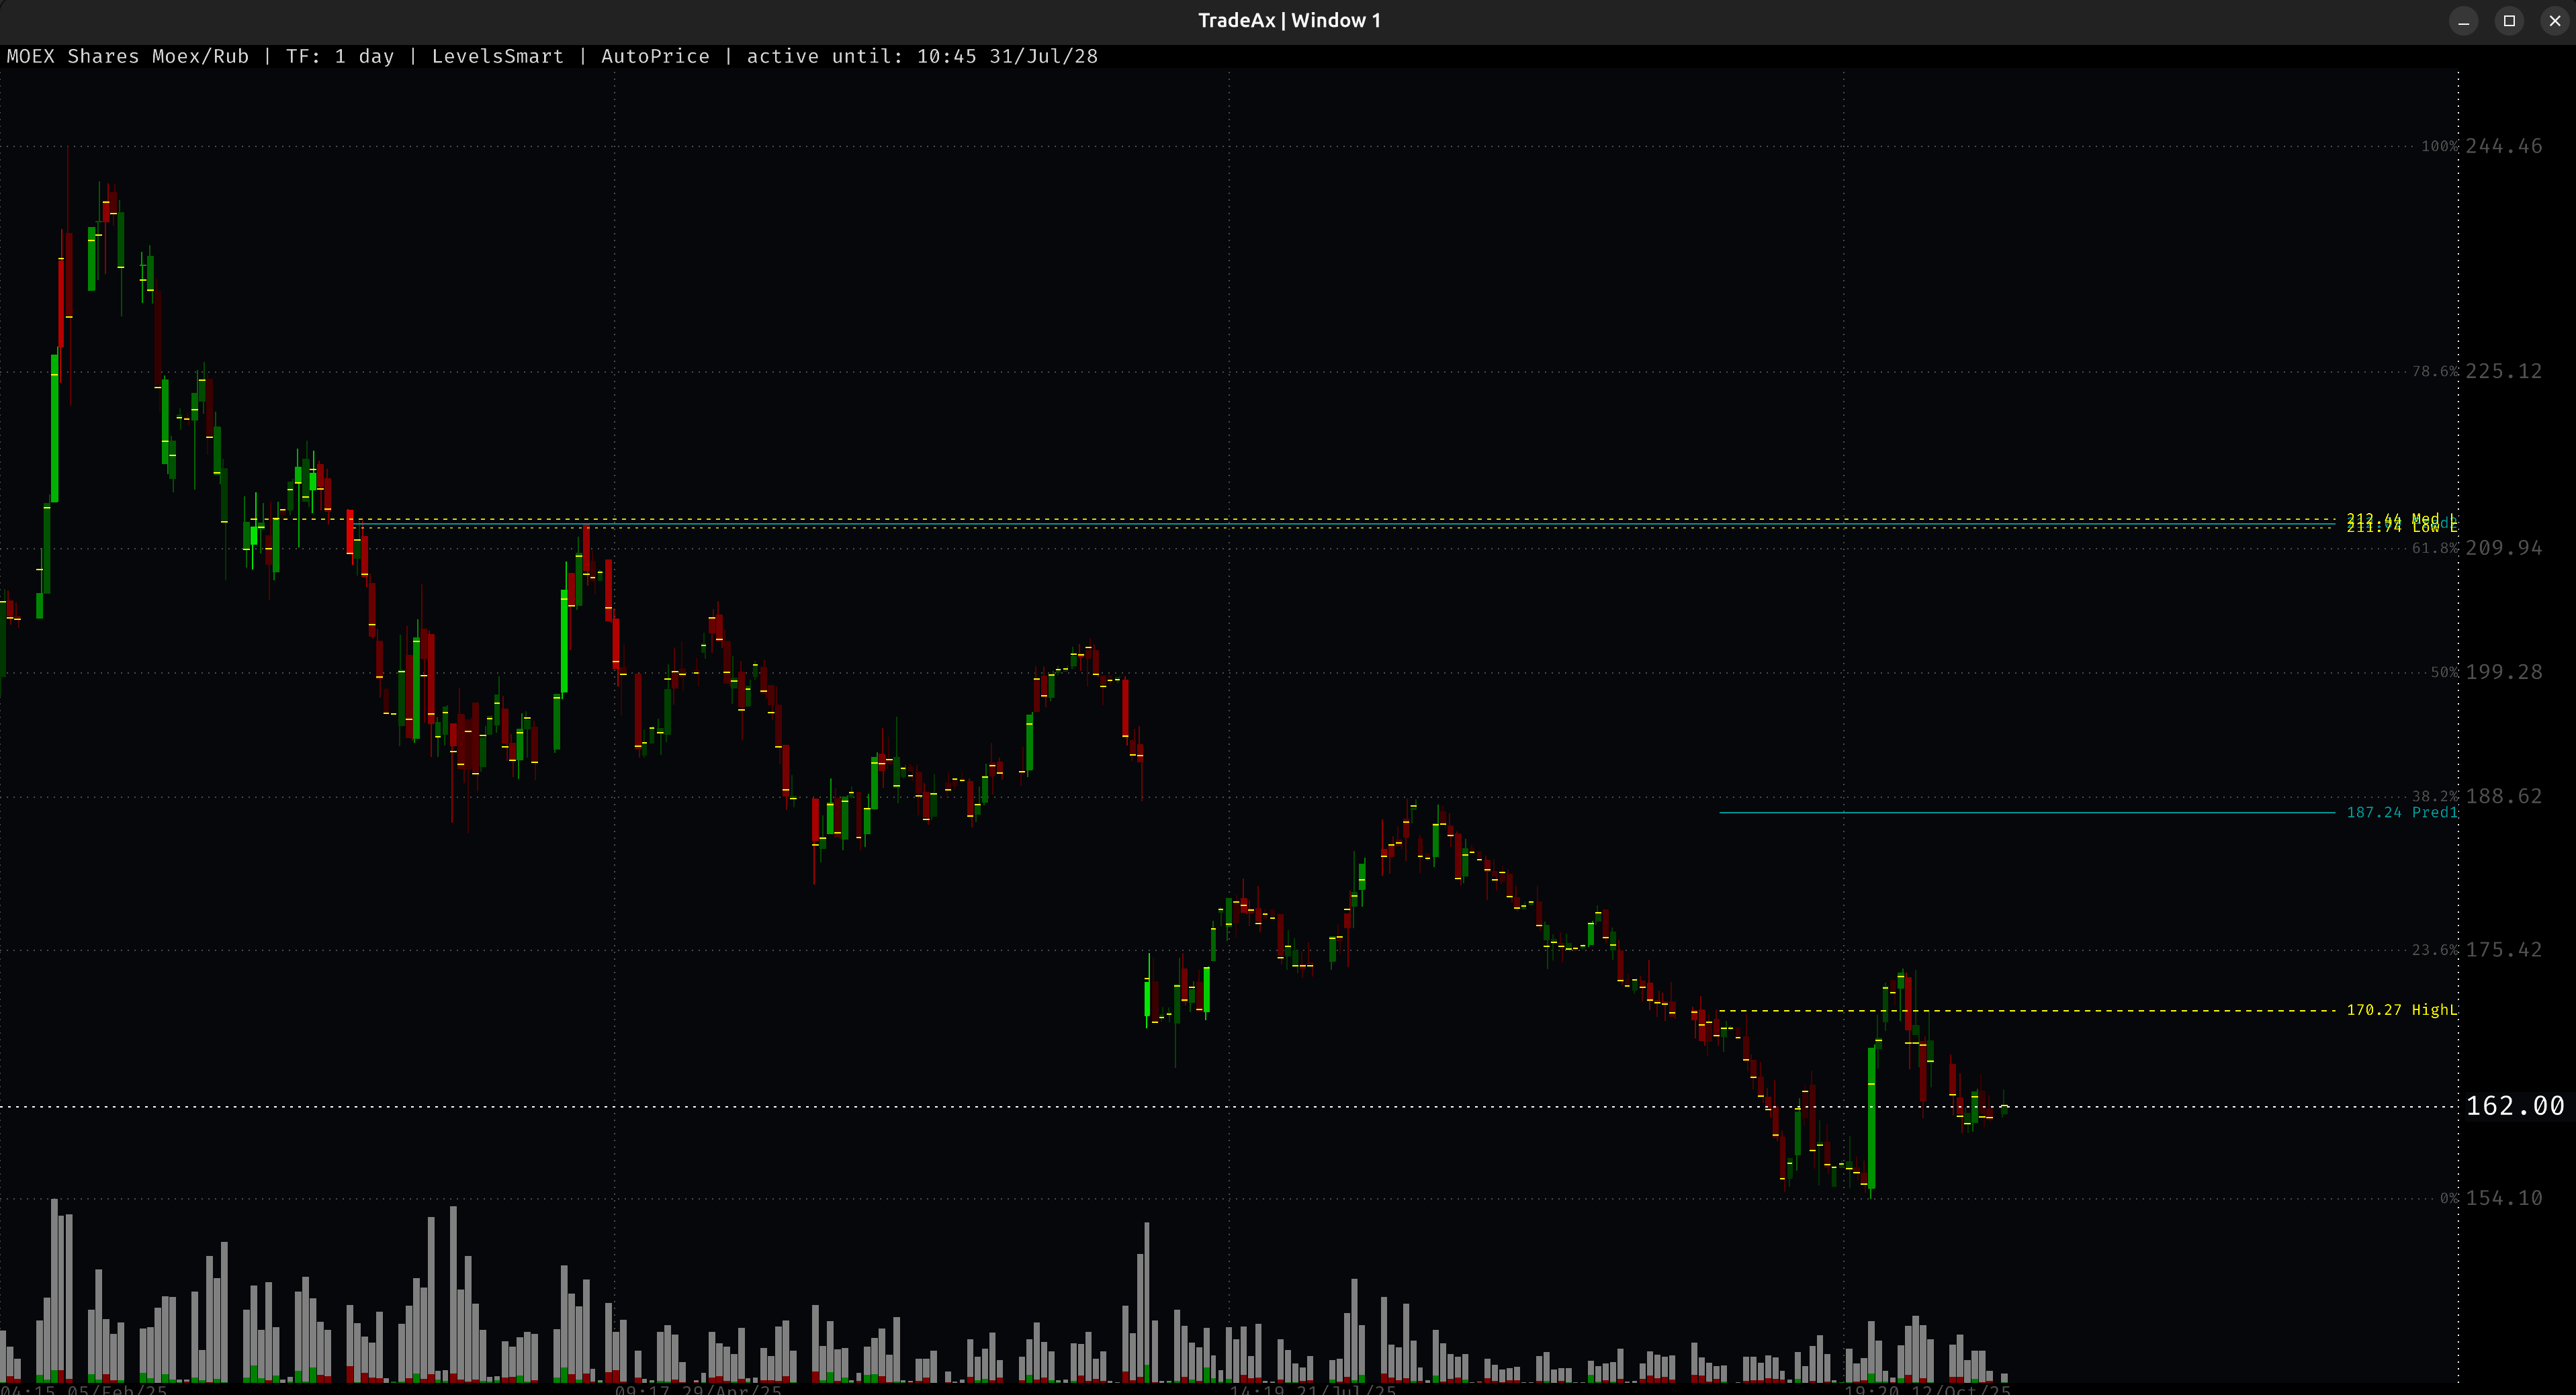
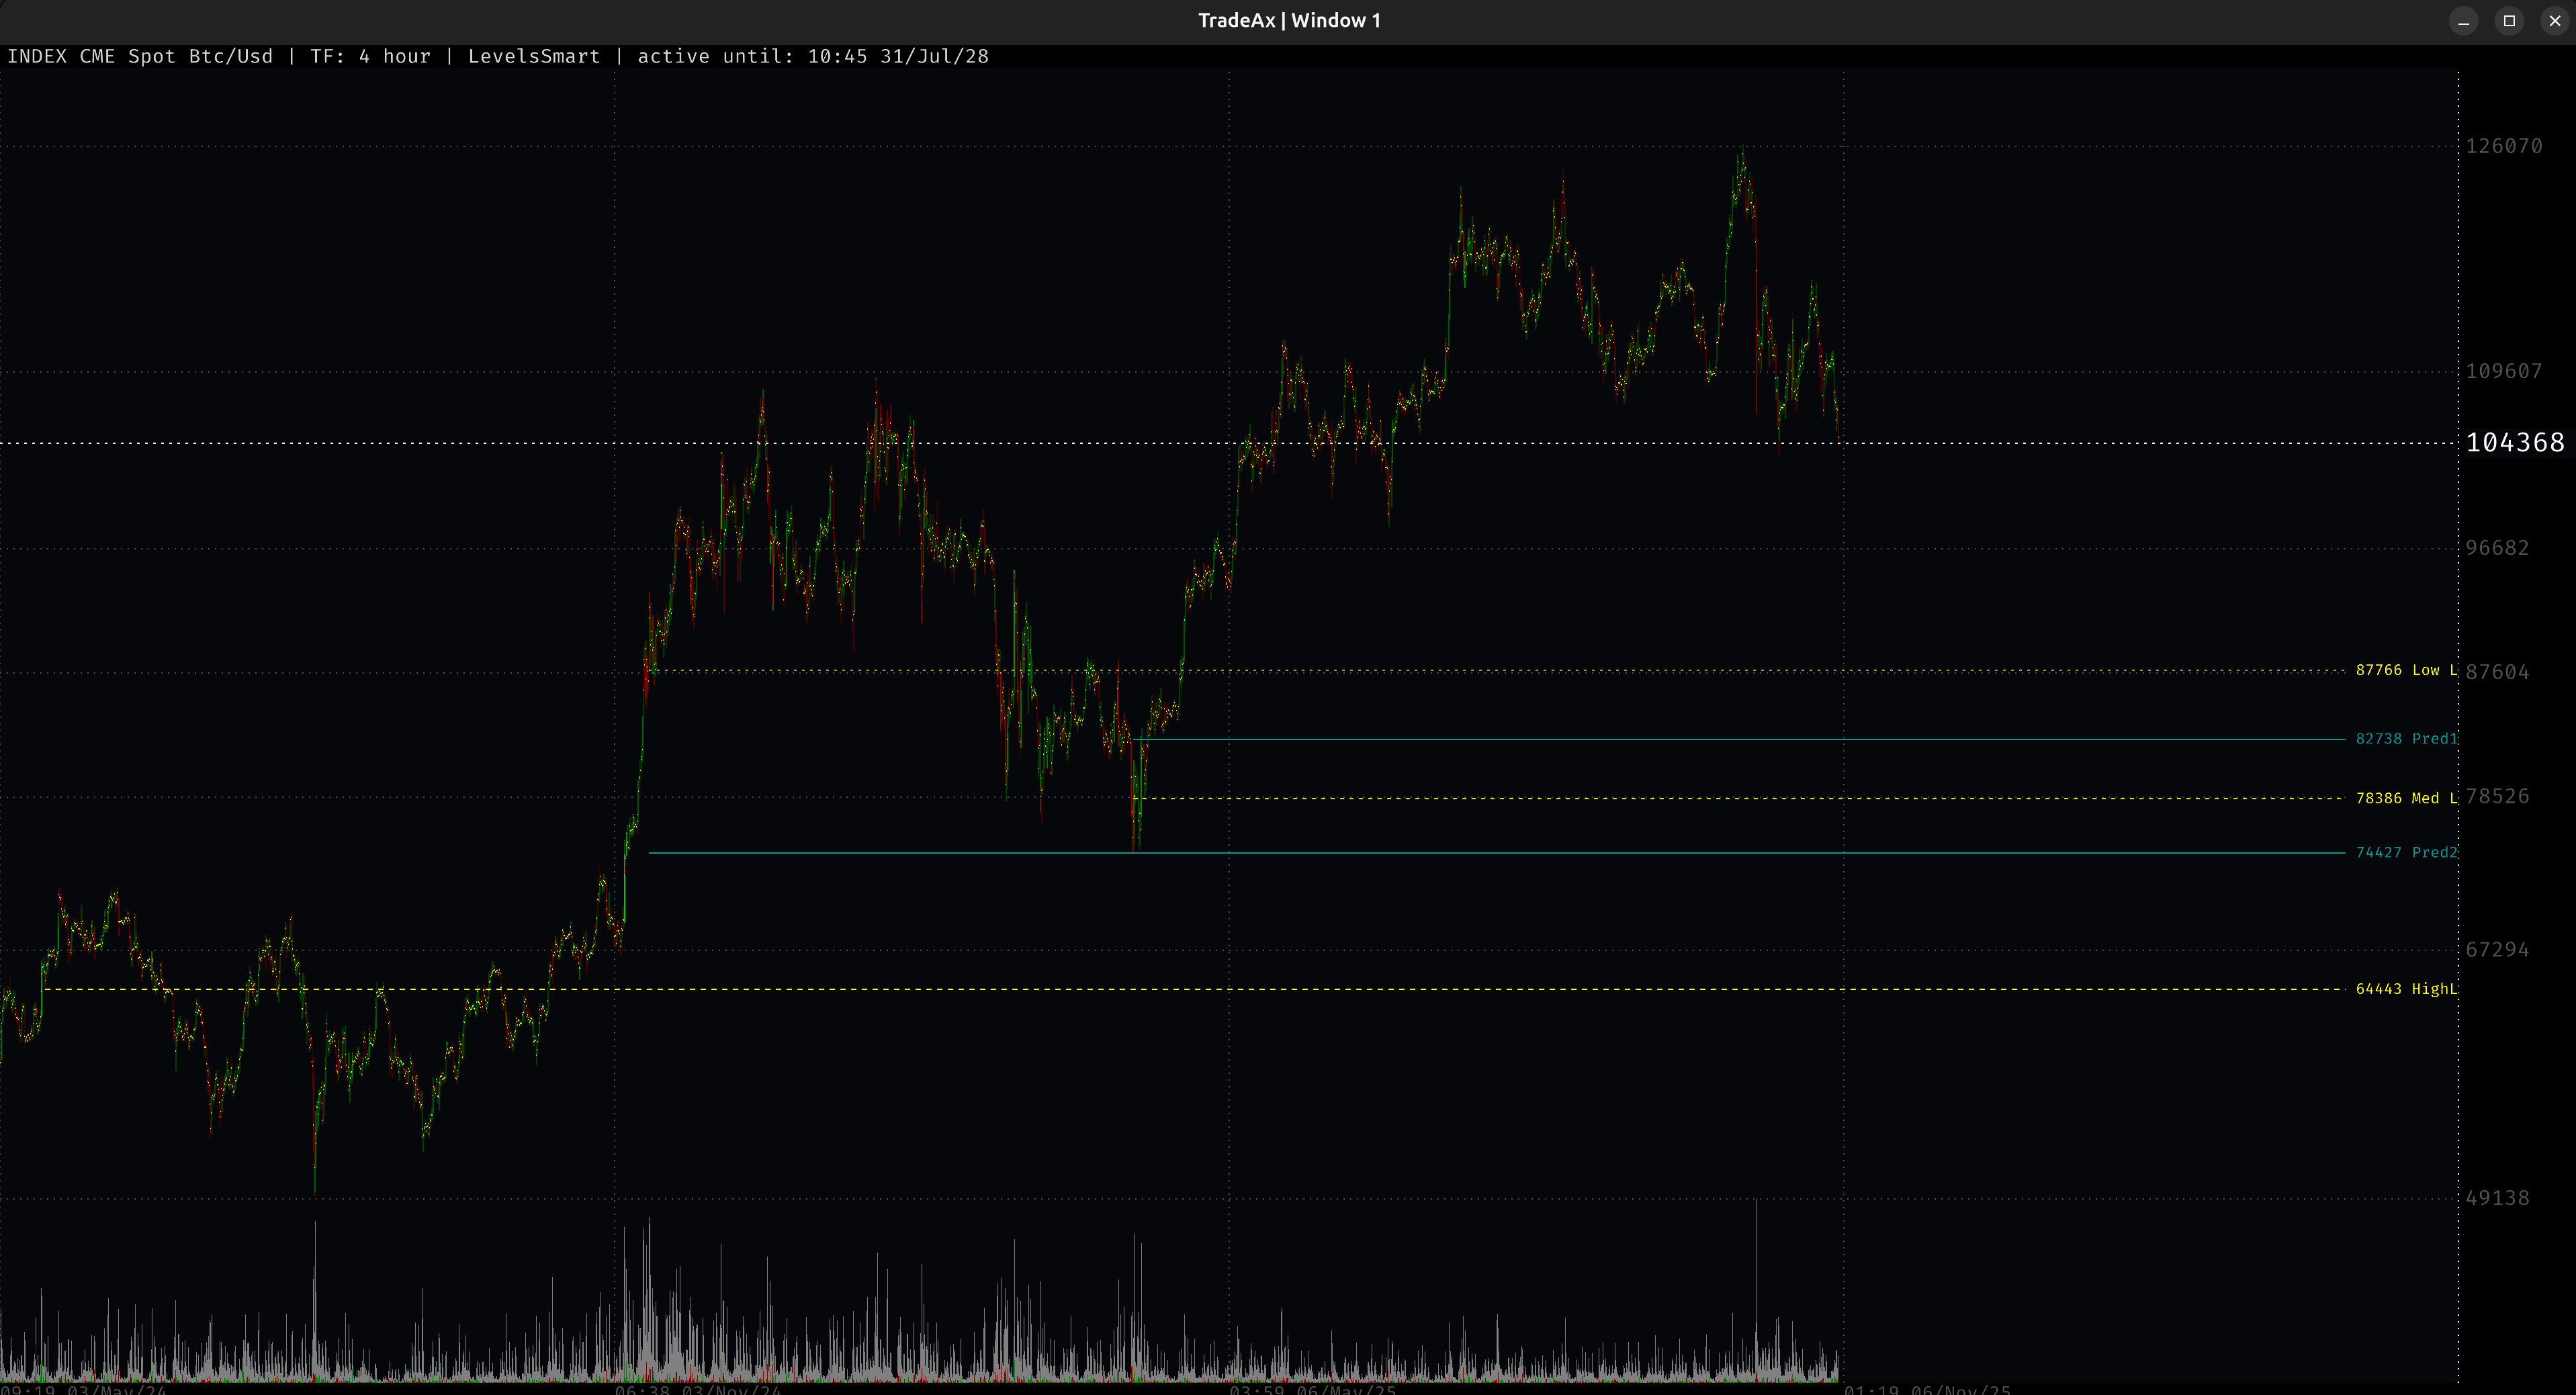
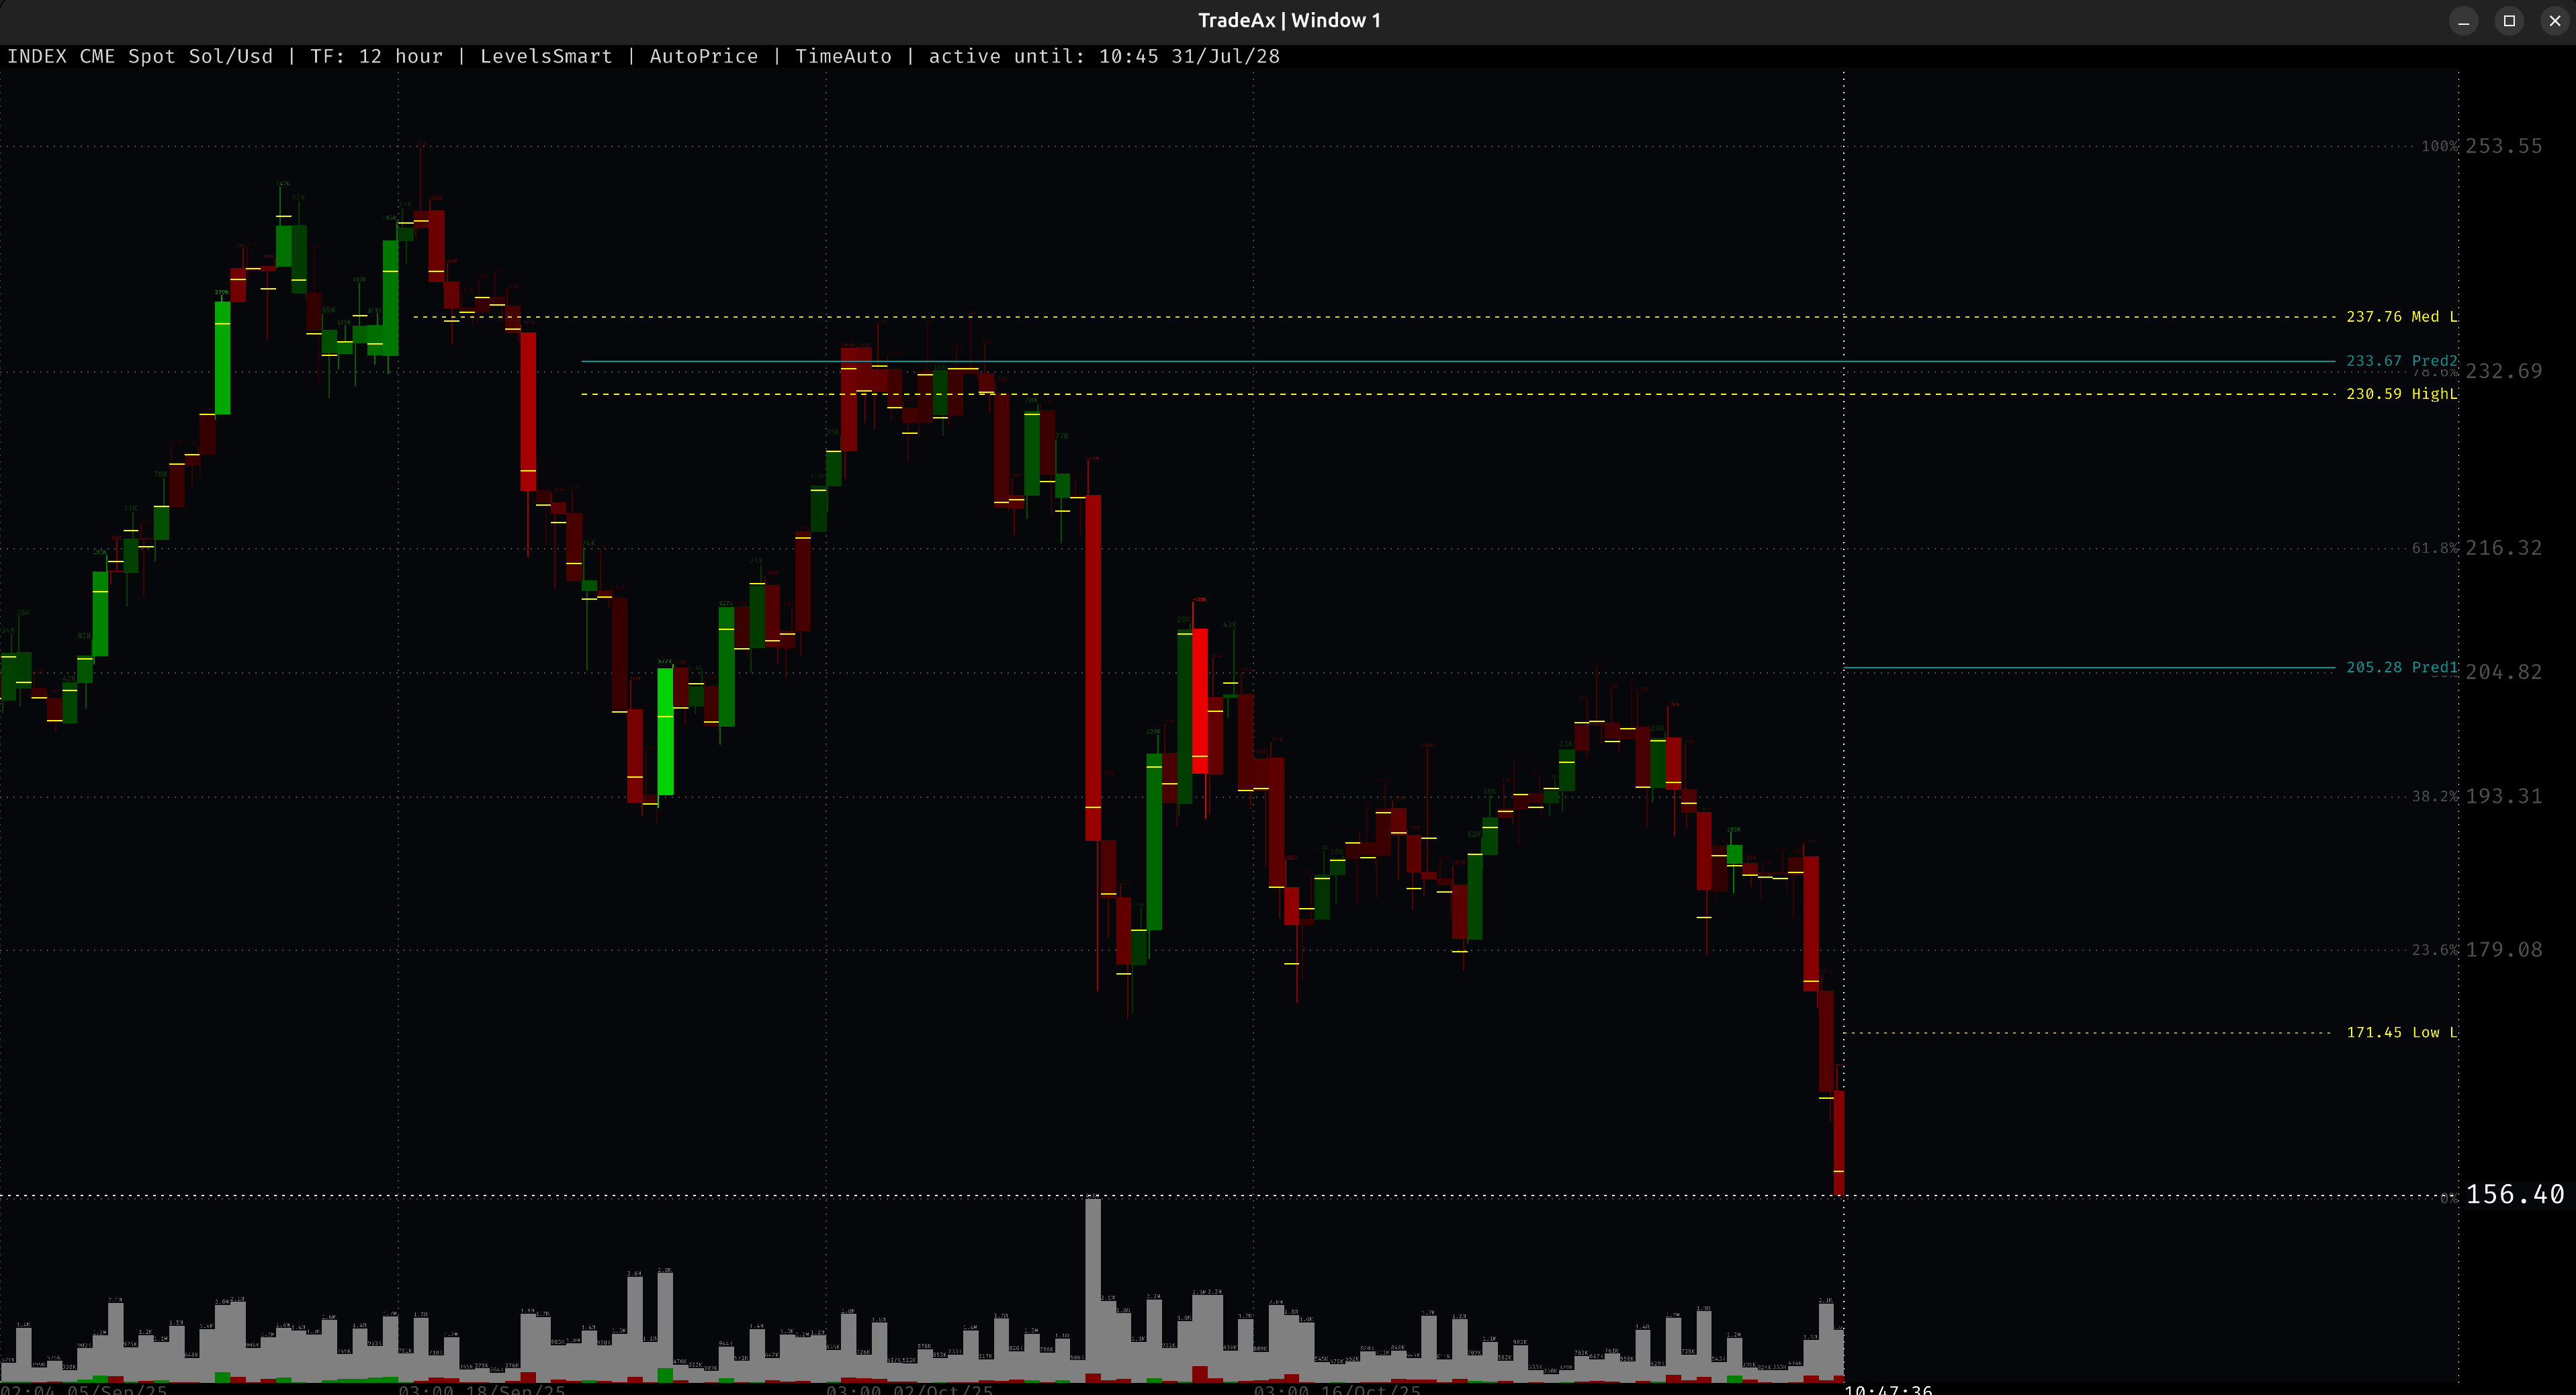
📈 3. SMARTLEVELS: ПОИСК СКОПЛЕНИЙ ЛИКВИДНОСТИ
Ключевые уровни, где сосредоточена ликвидность, — это магниты для цены. Наш инструмент автоматически находит эти зоны, указывая на потенциальные точки для сильных движений или разворотов.
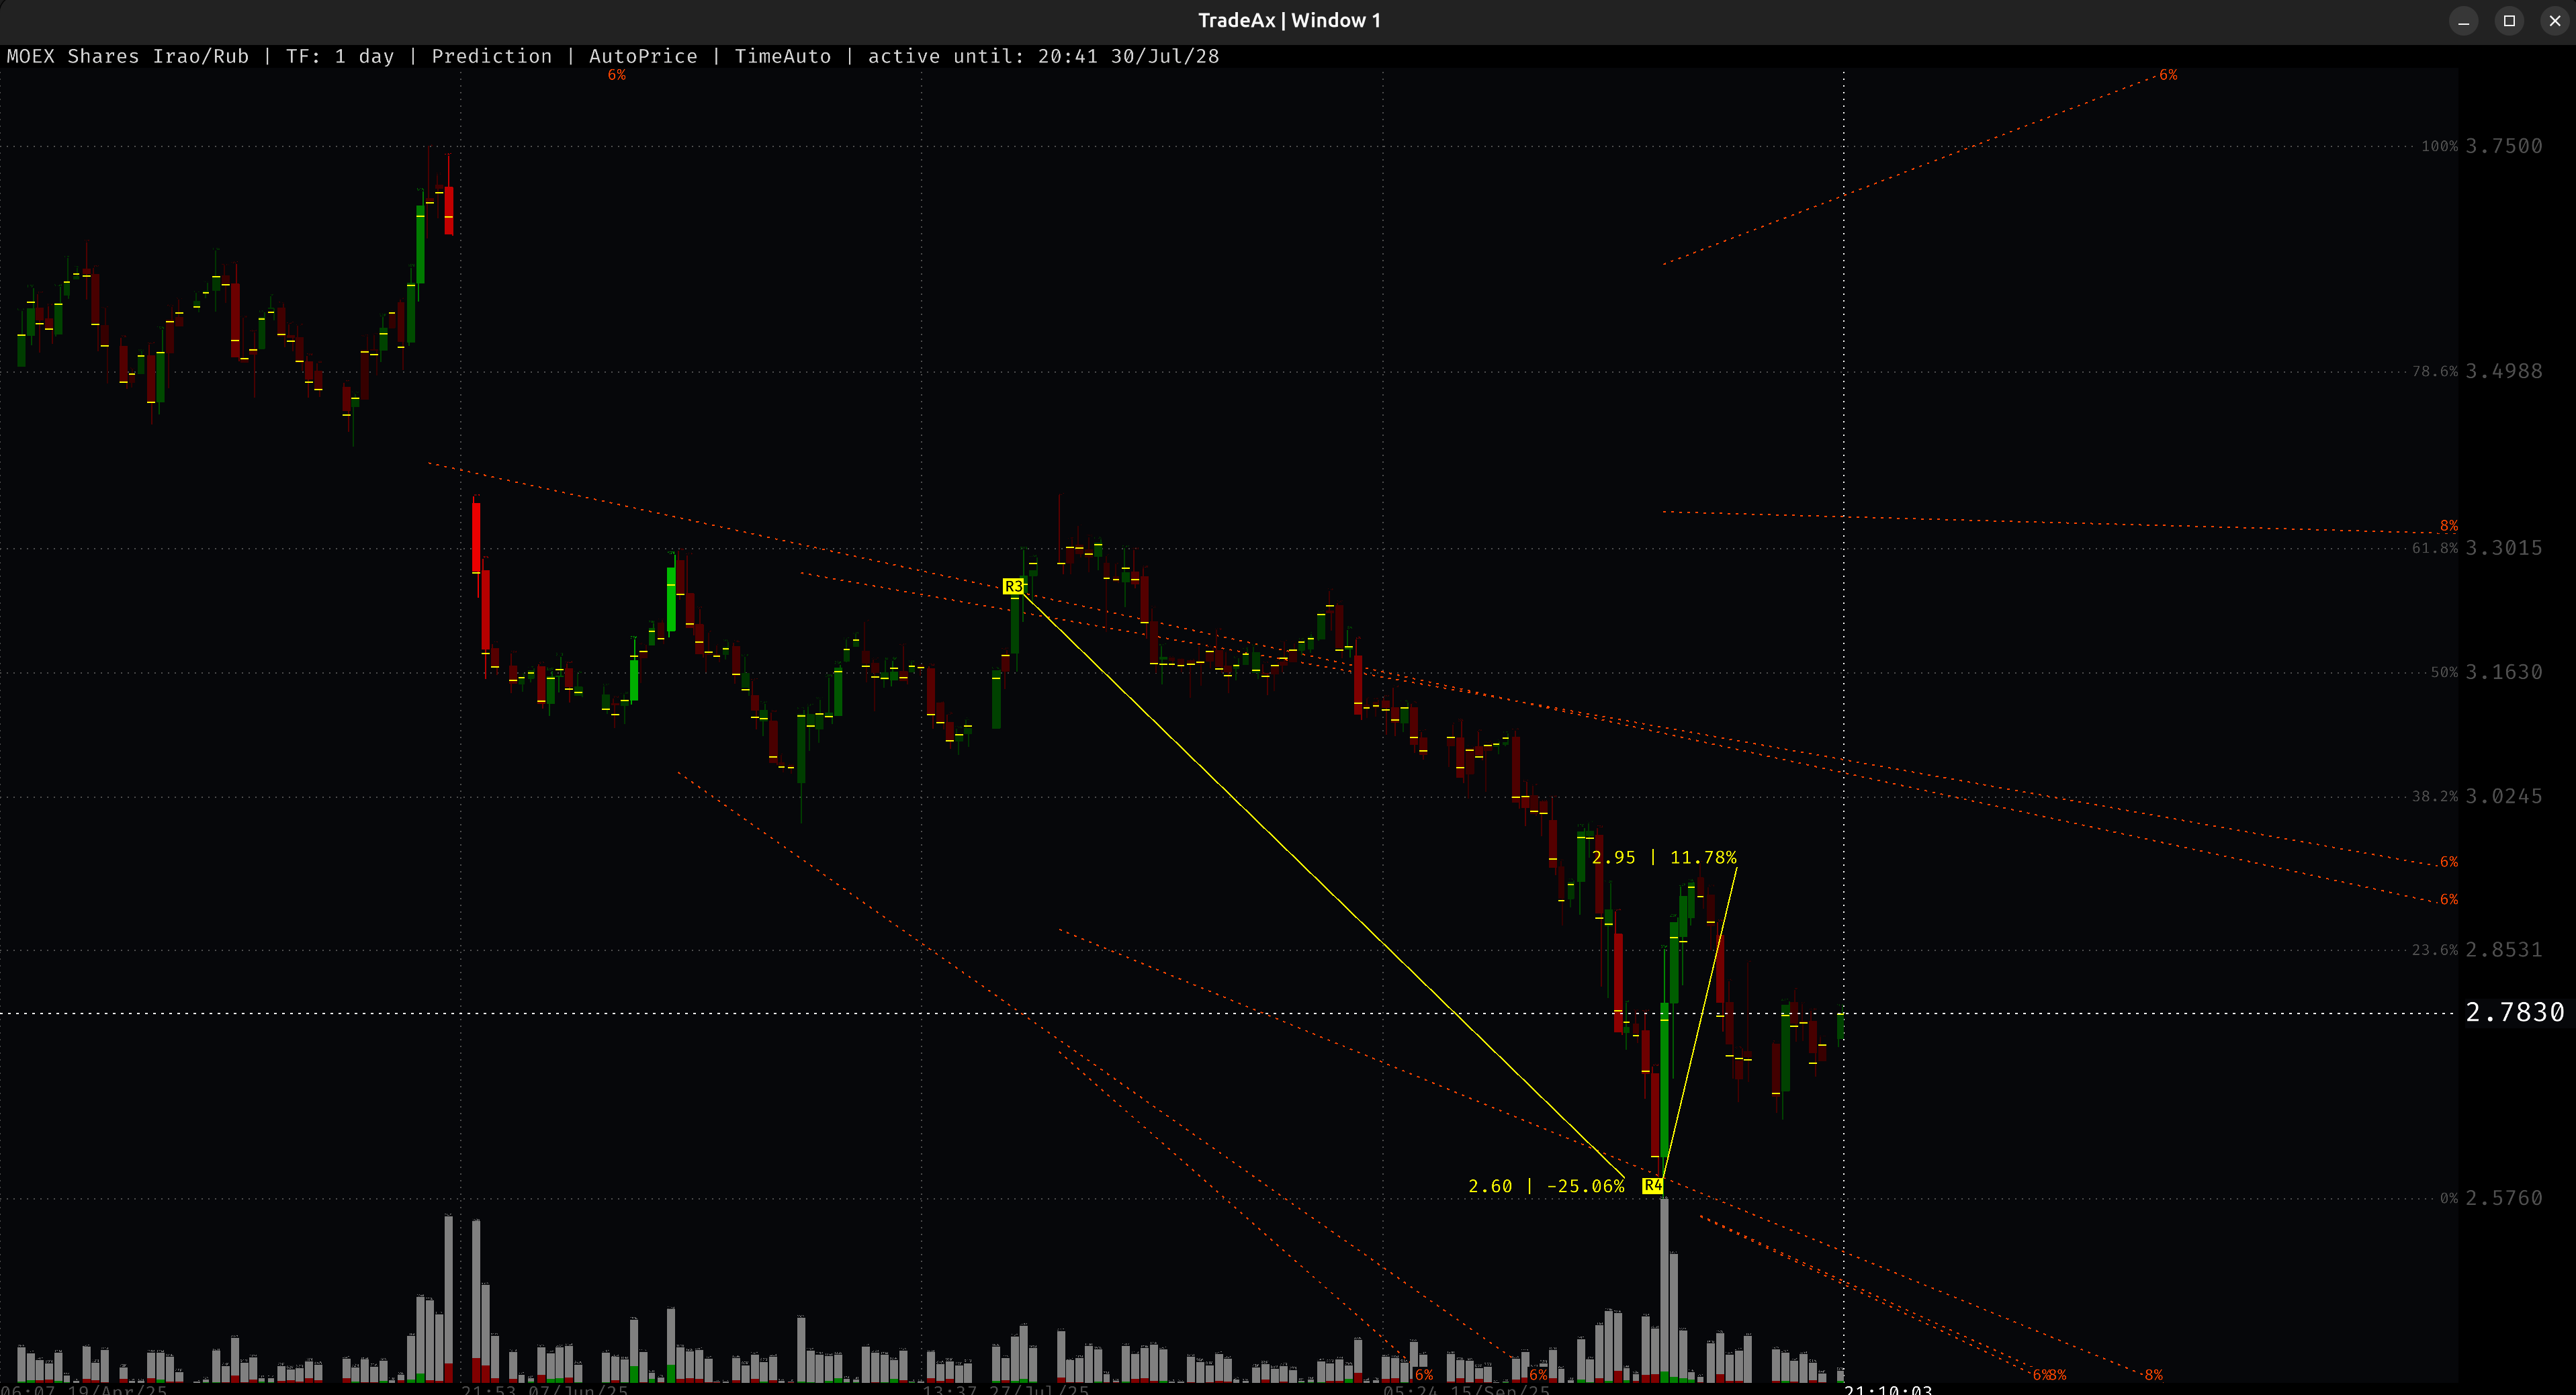
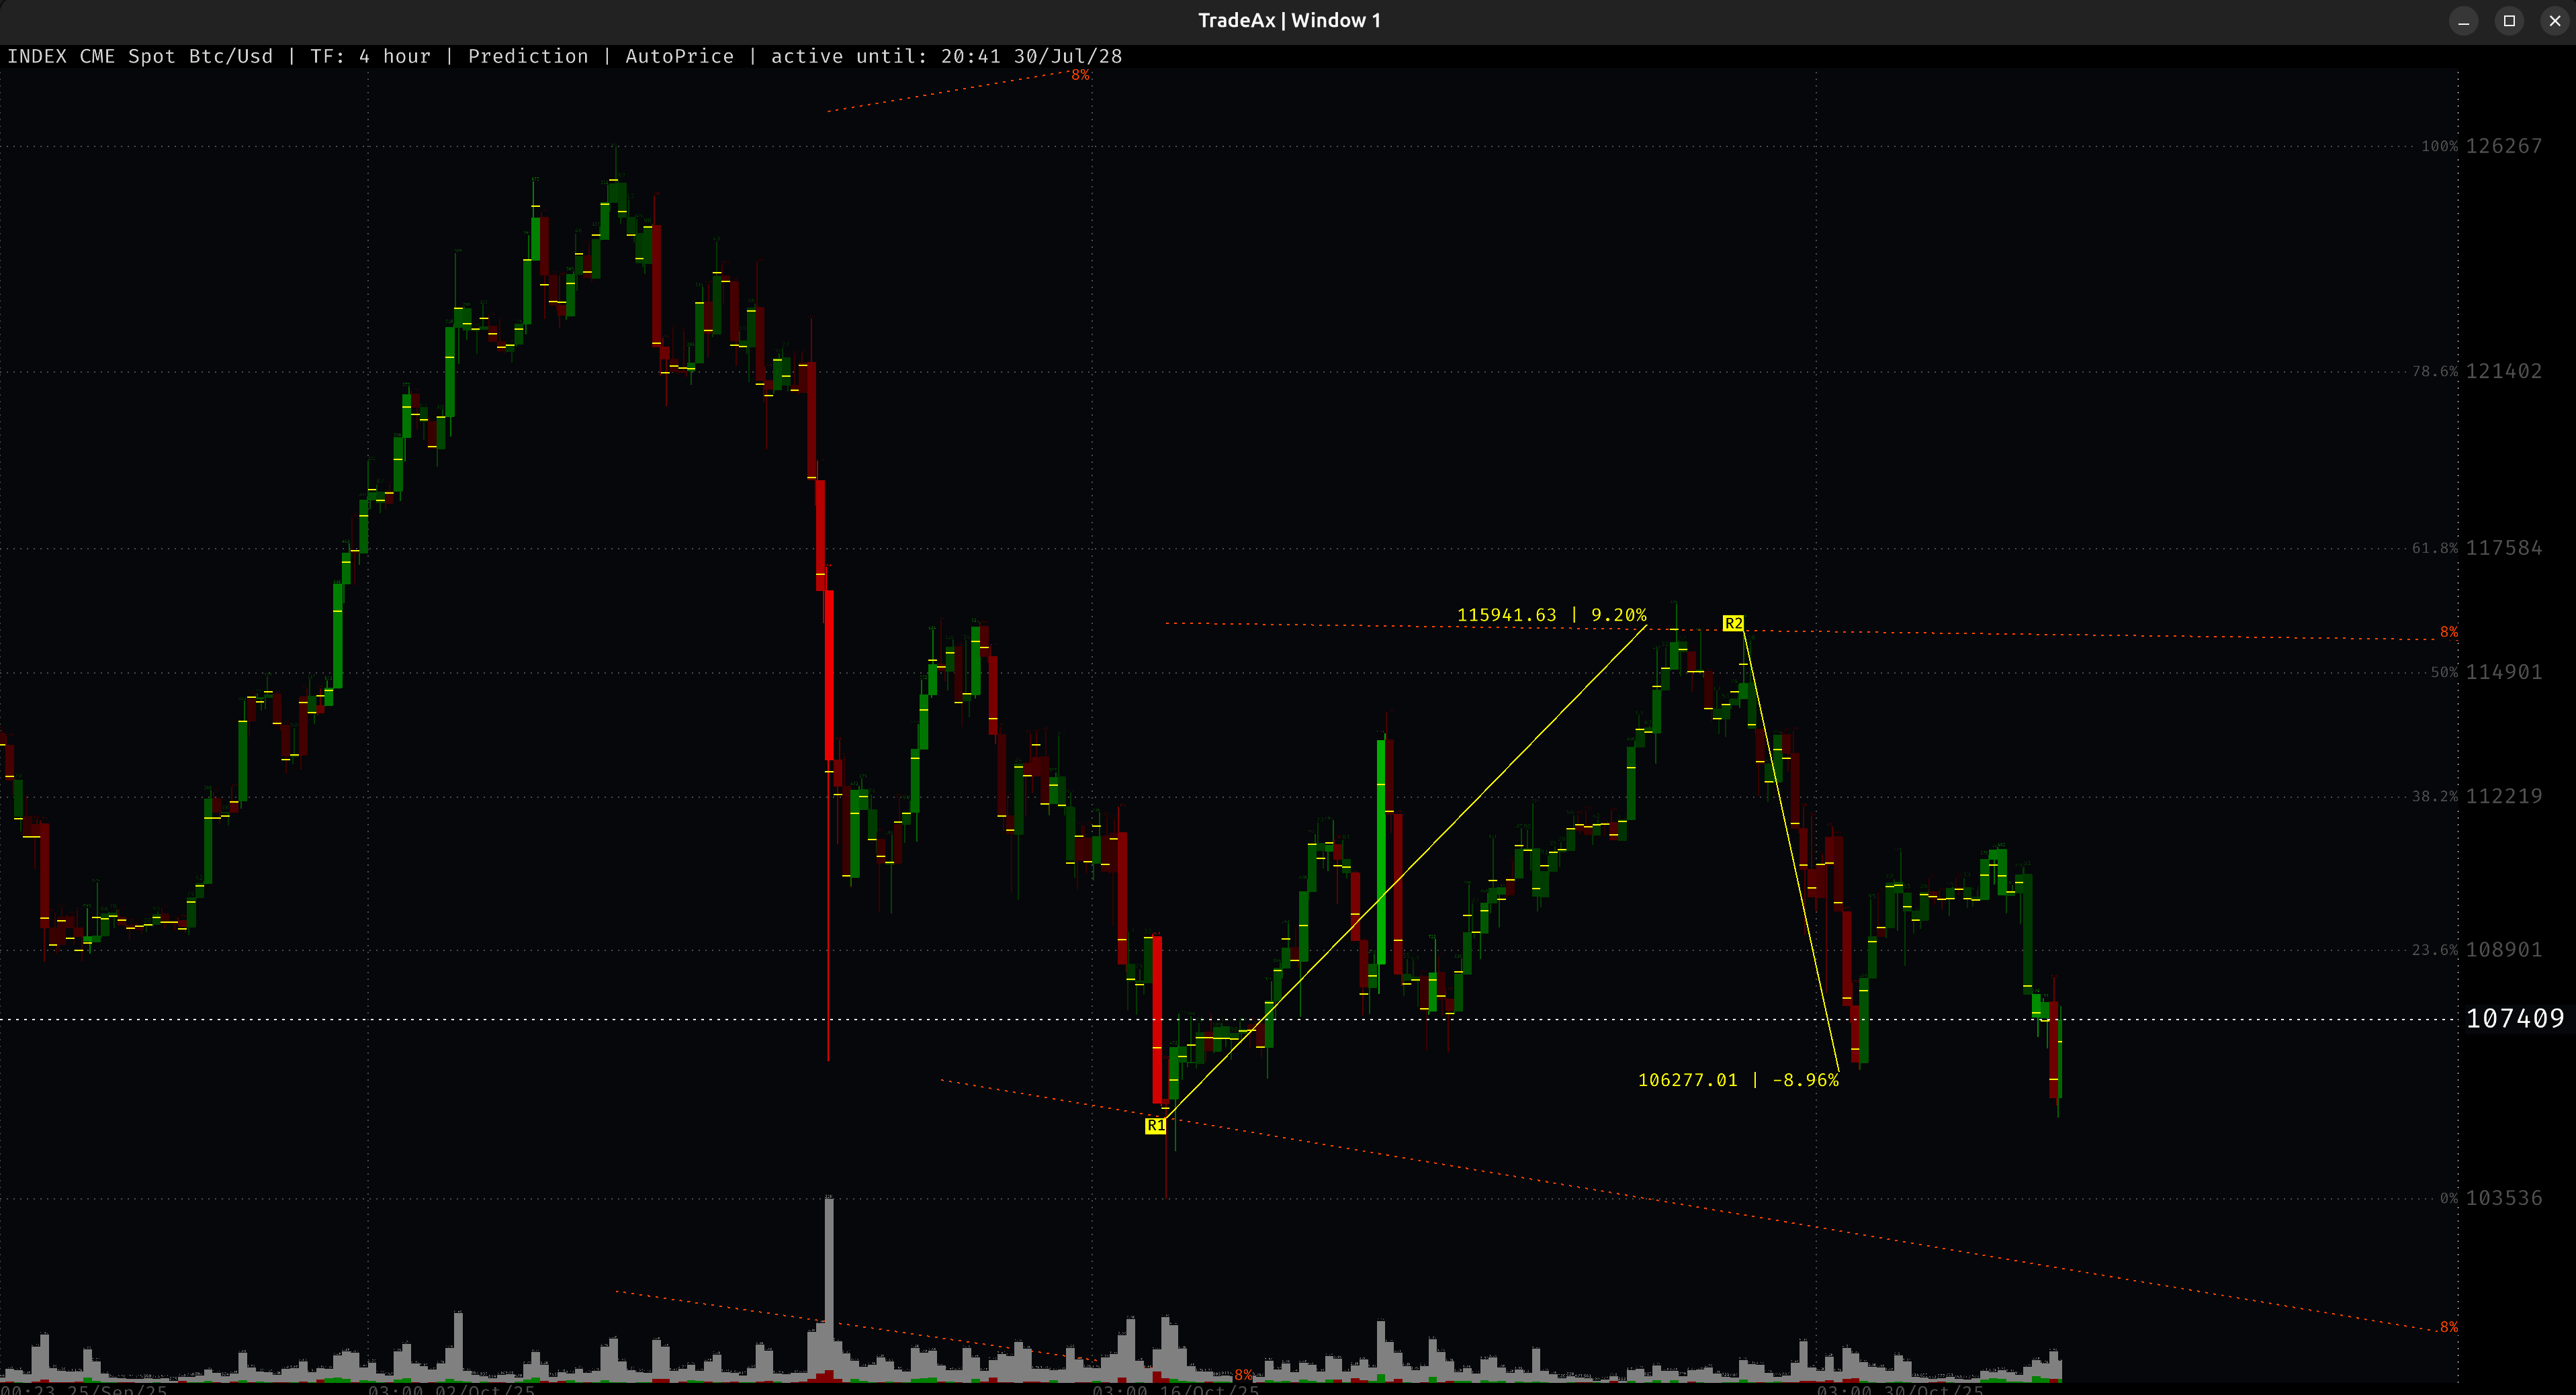
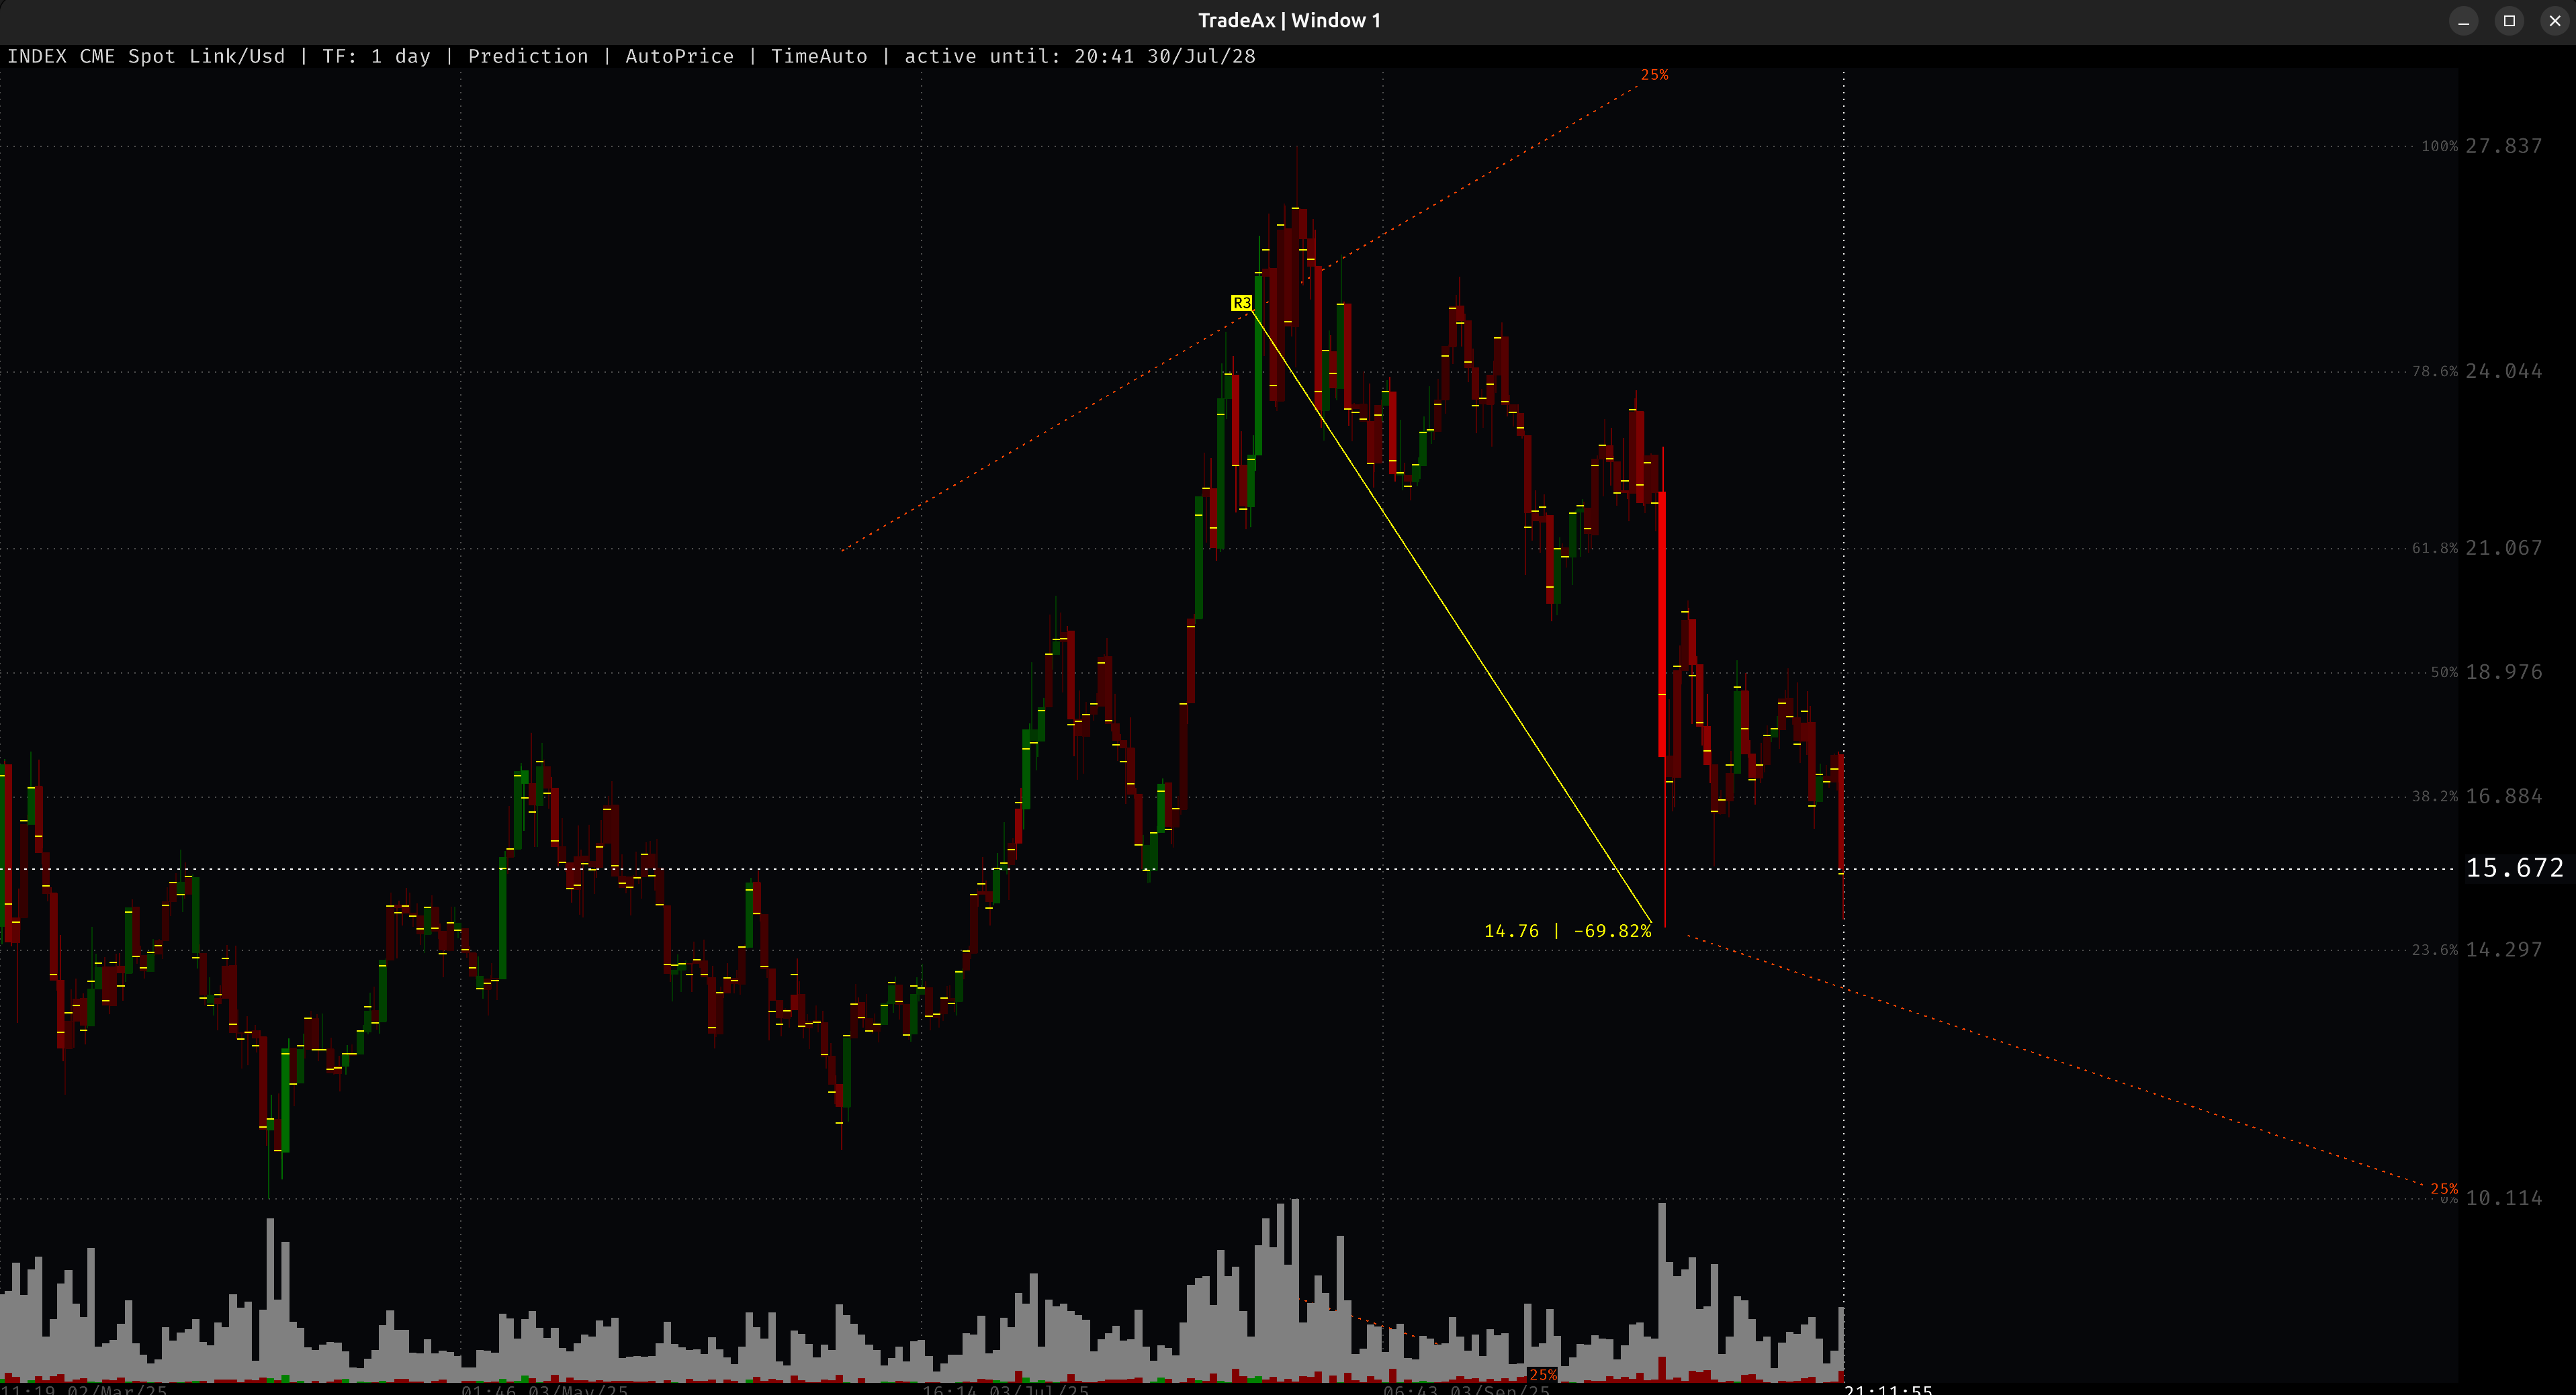
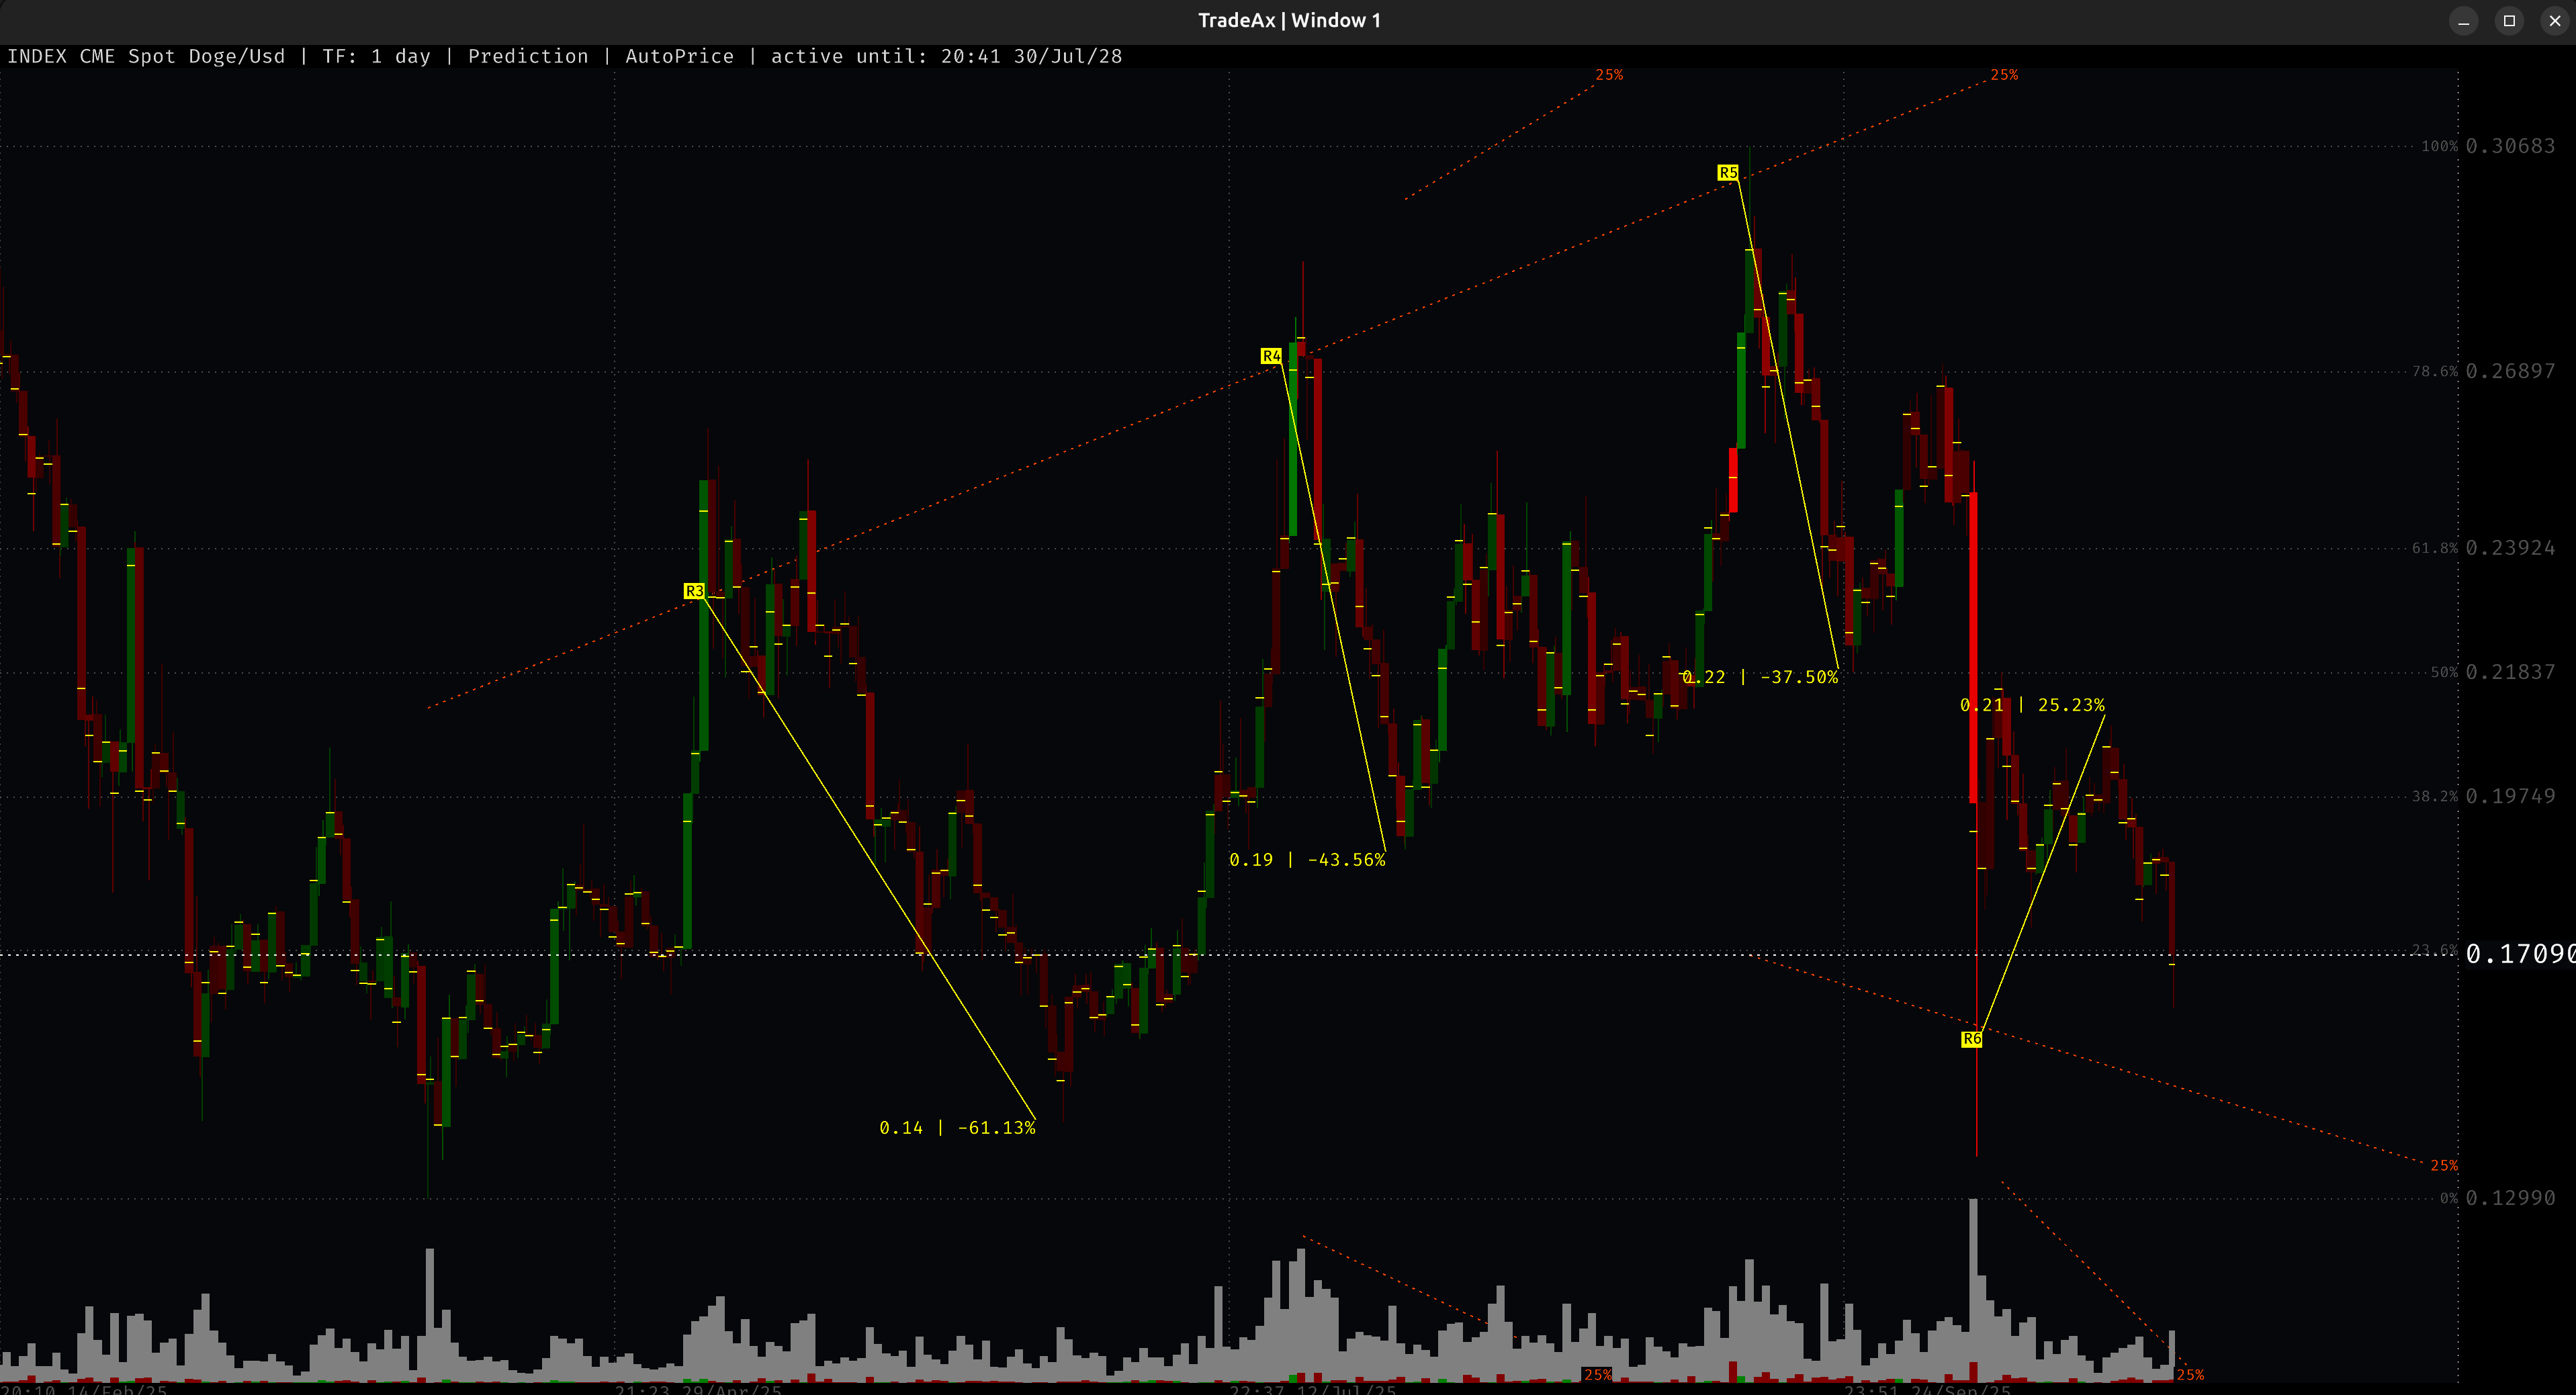
🔮 4. PREDICTIONS: ПРОГНОЗ РАЗВОРОТНЫХ ТОЧЕК
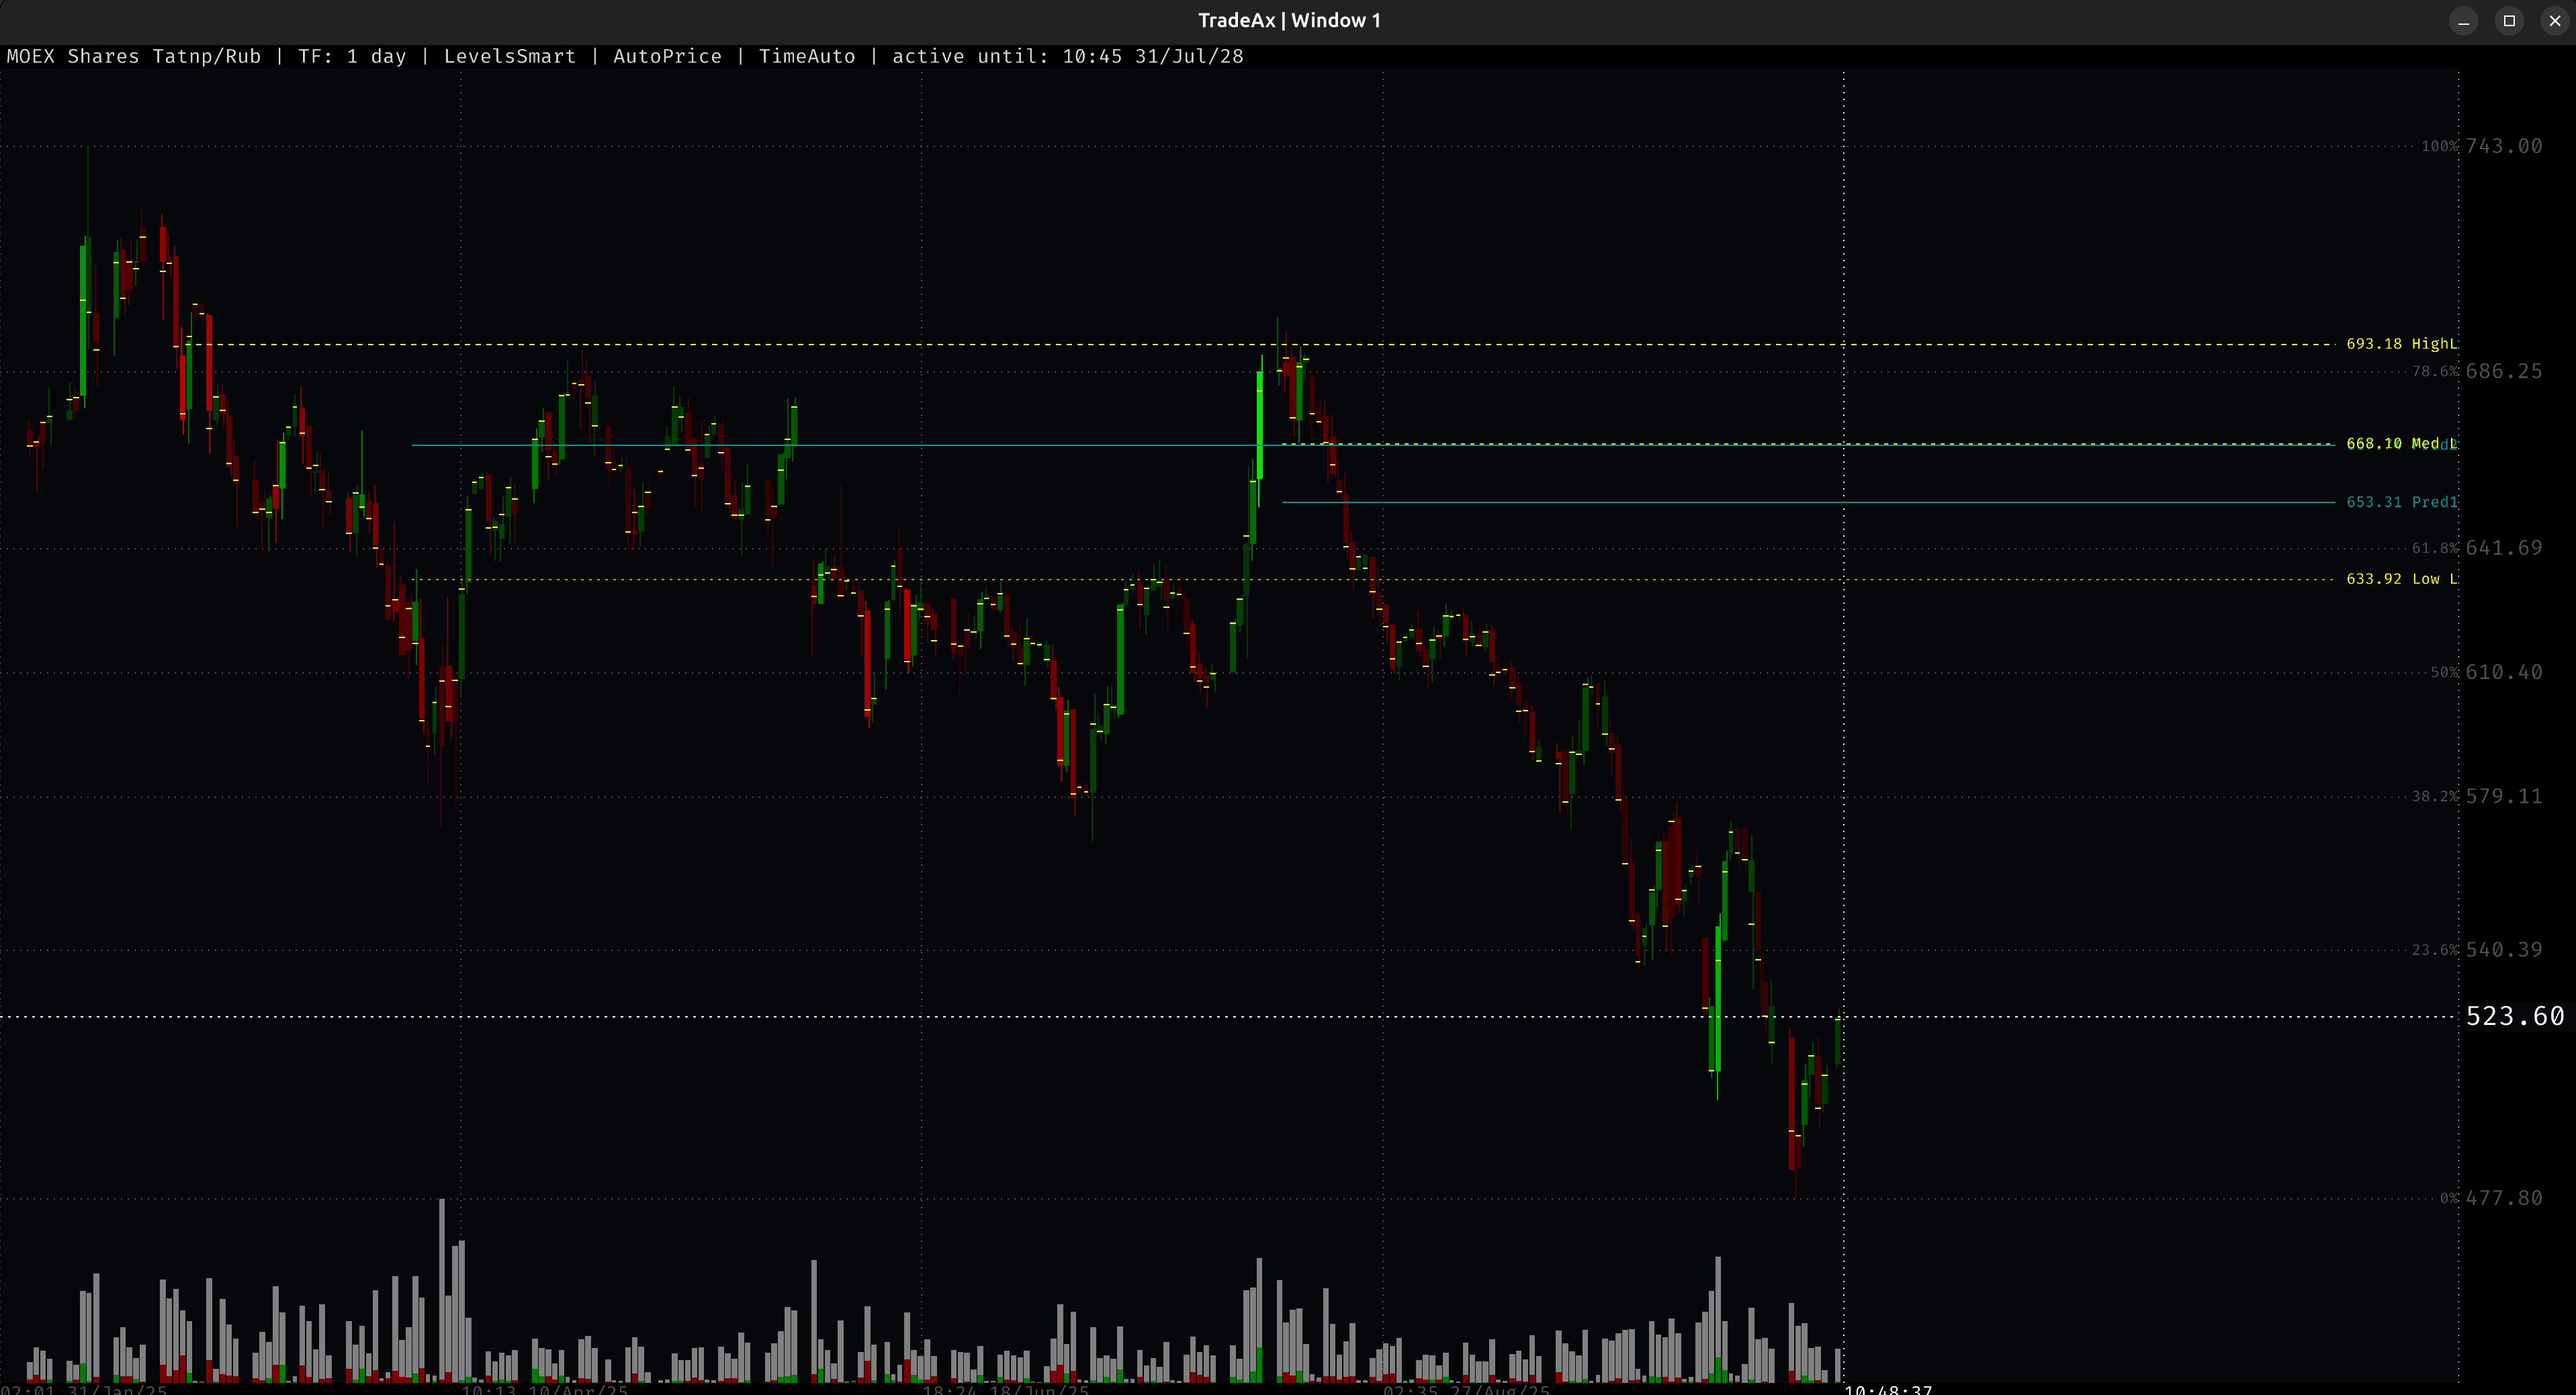
Система в автоматическом режиме рассчитывает уровни, с высокой вероятностью которых может произойти разворот тренда, а также прогнозирует потенциальную силу отскока в процентном соотношении.
📊 5. CLUSTER: ГОРИЗОНТАЛЬНАЯ ДЕЛЬТА
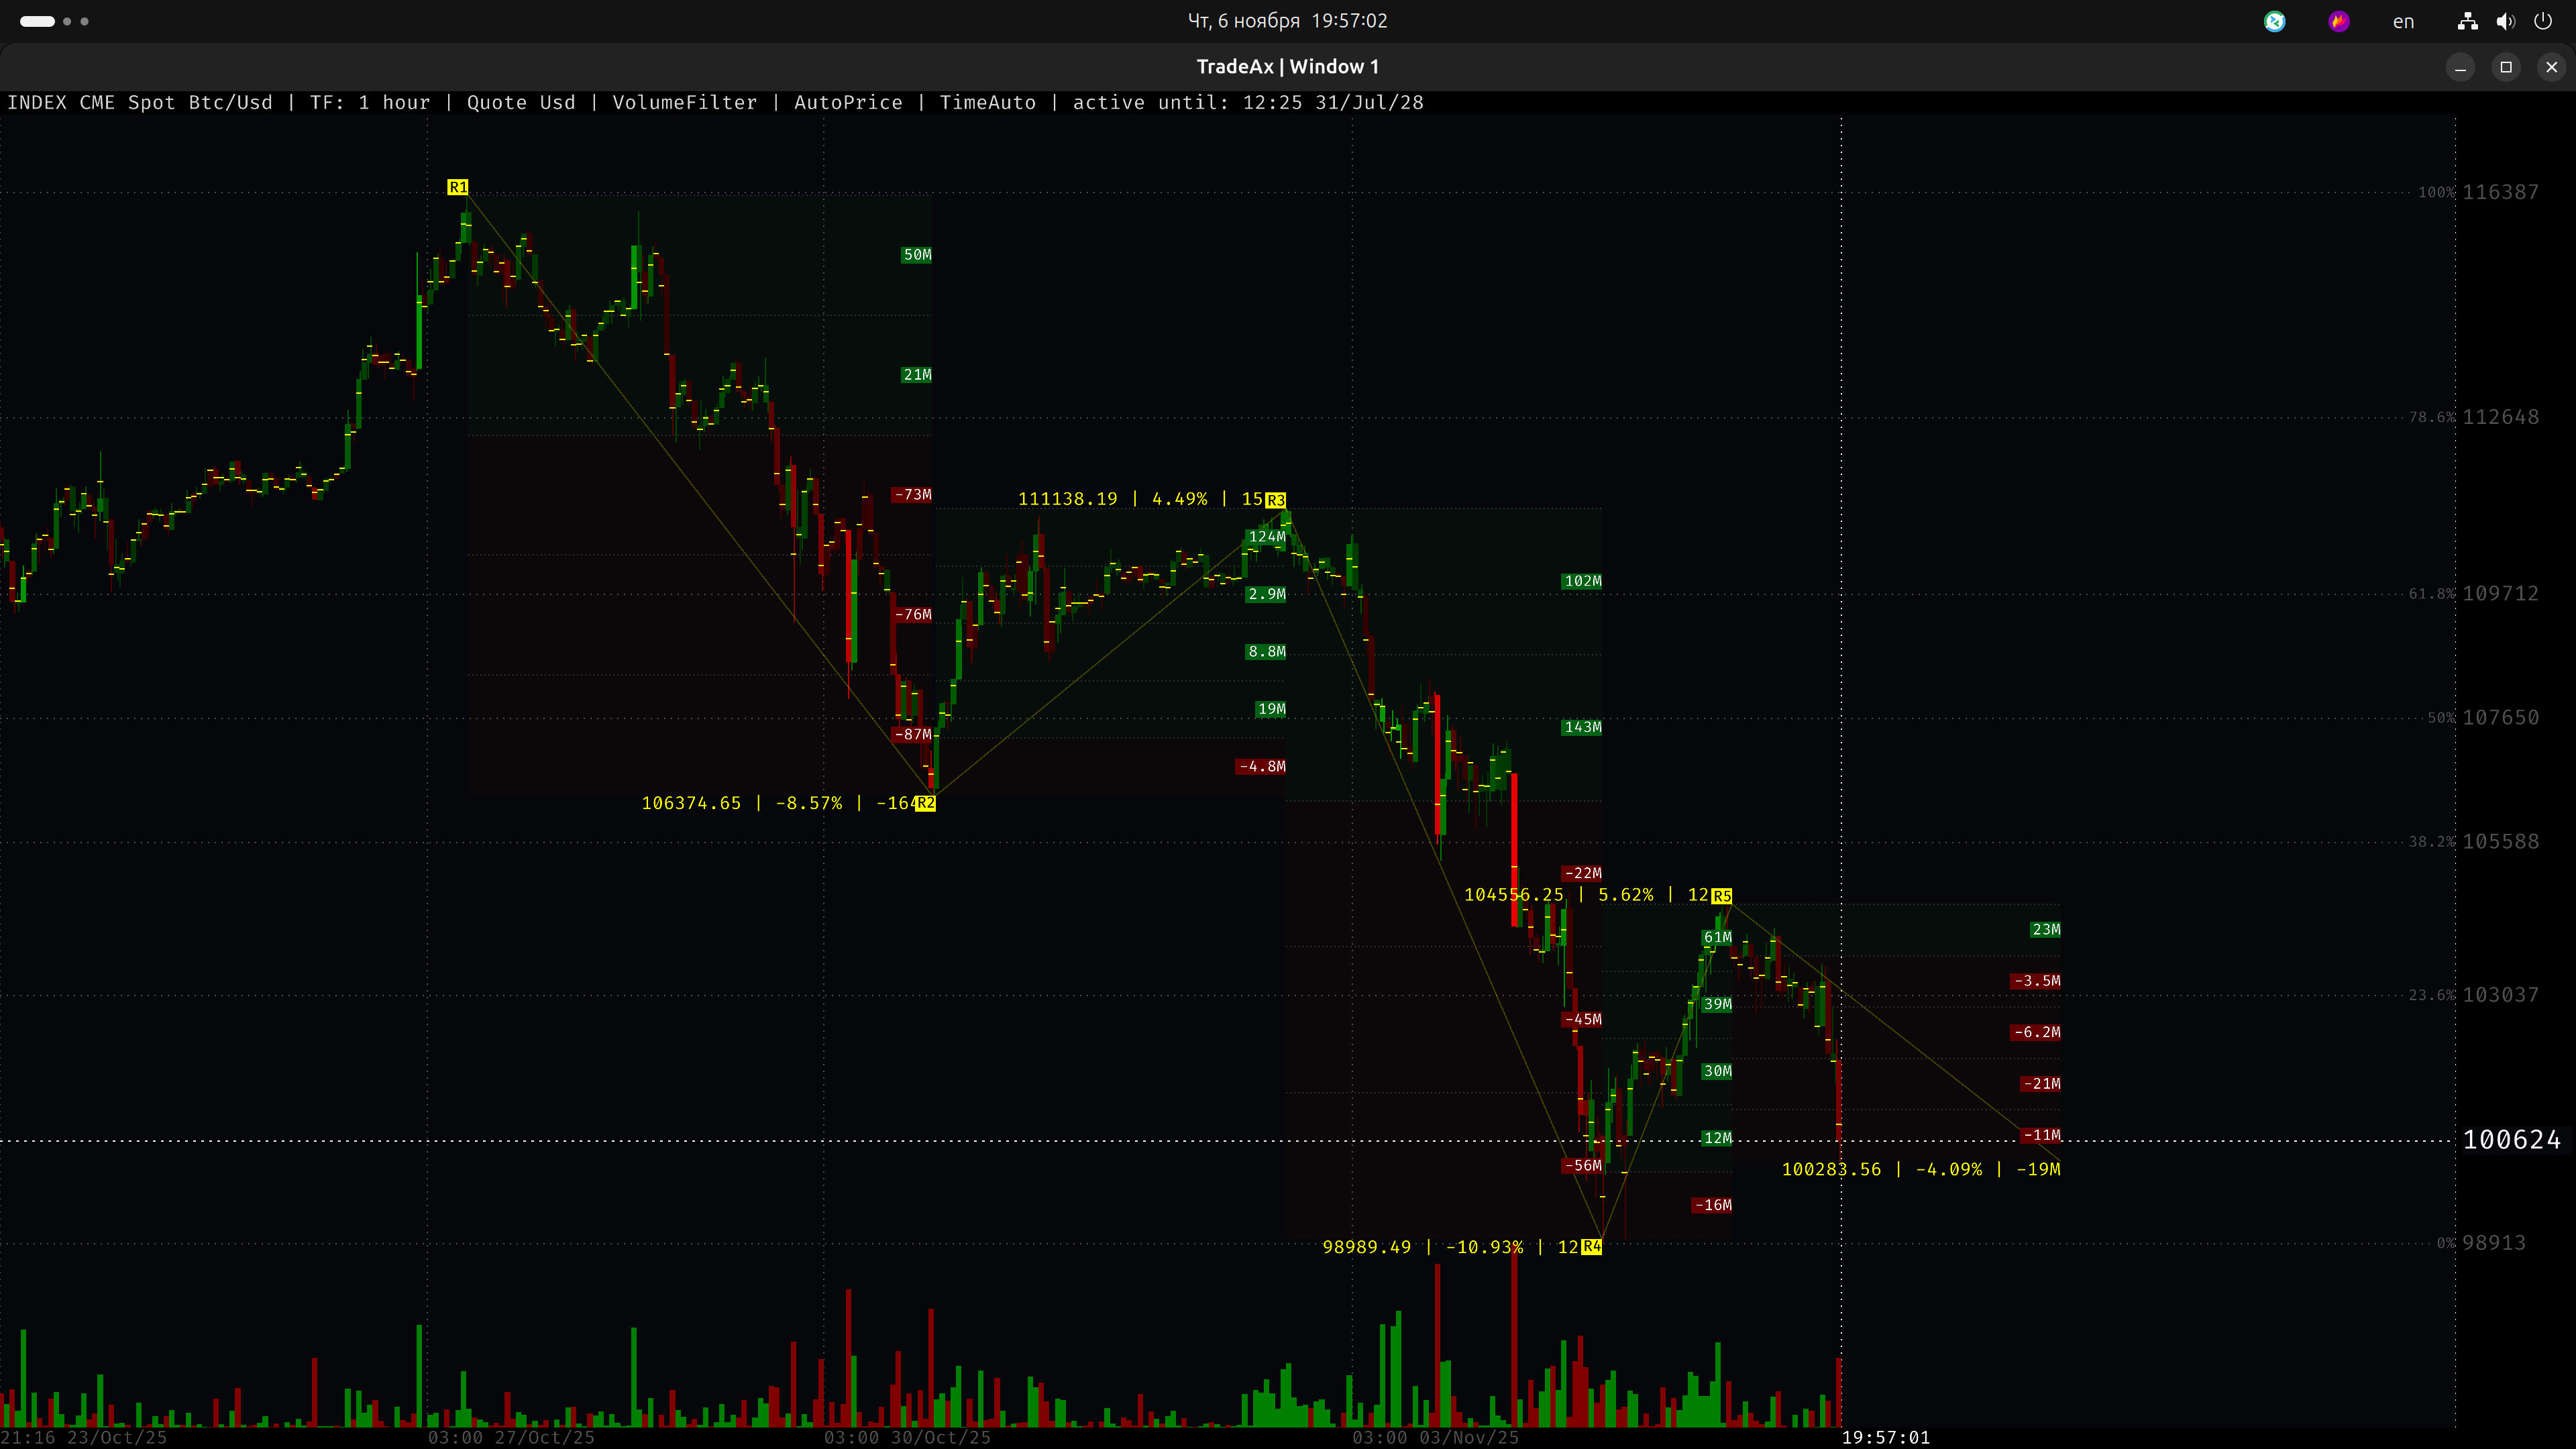
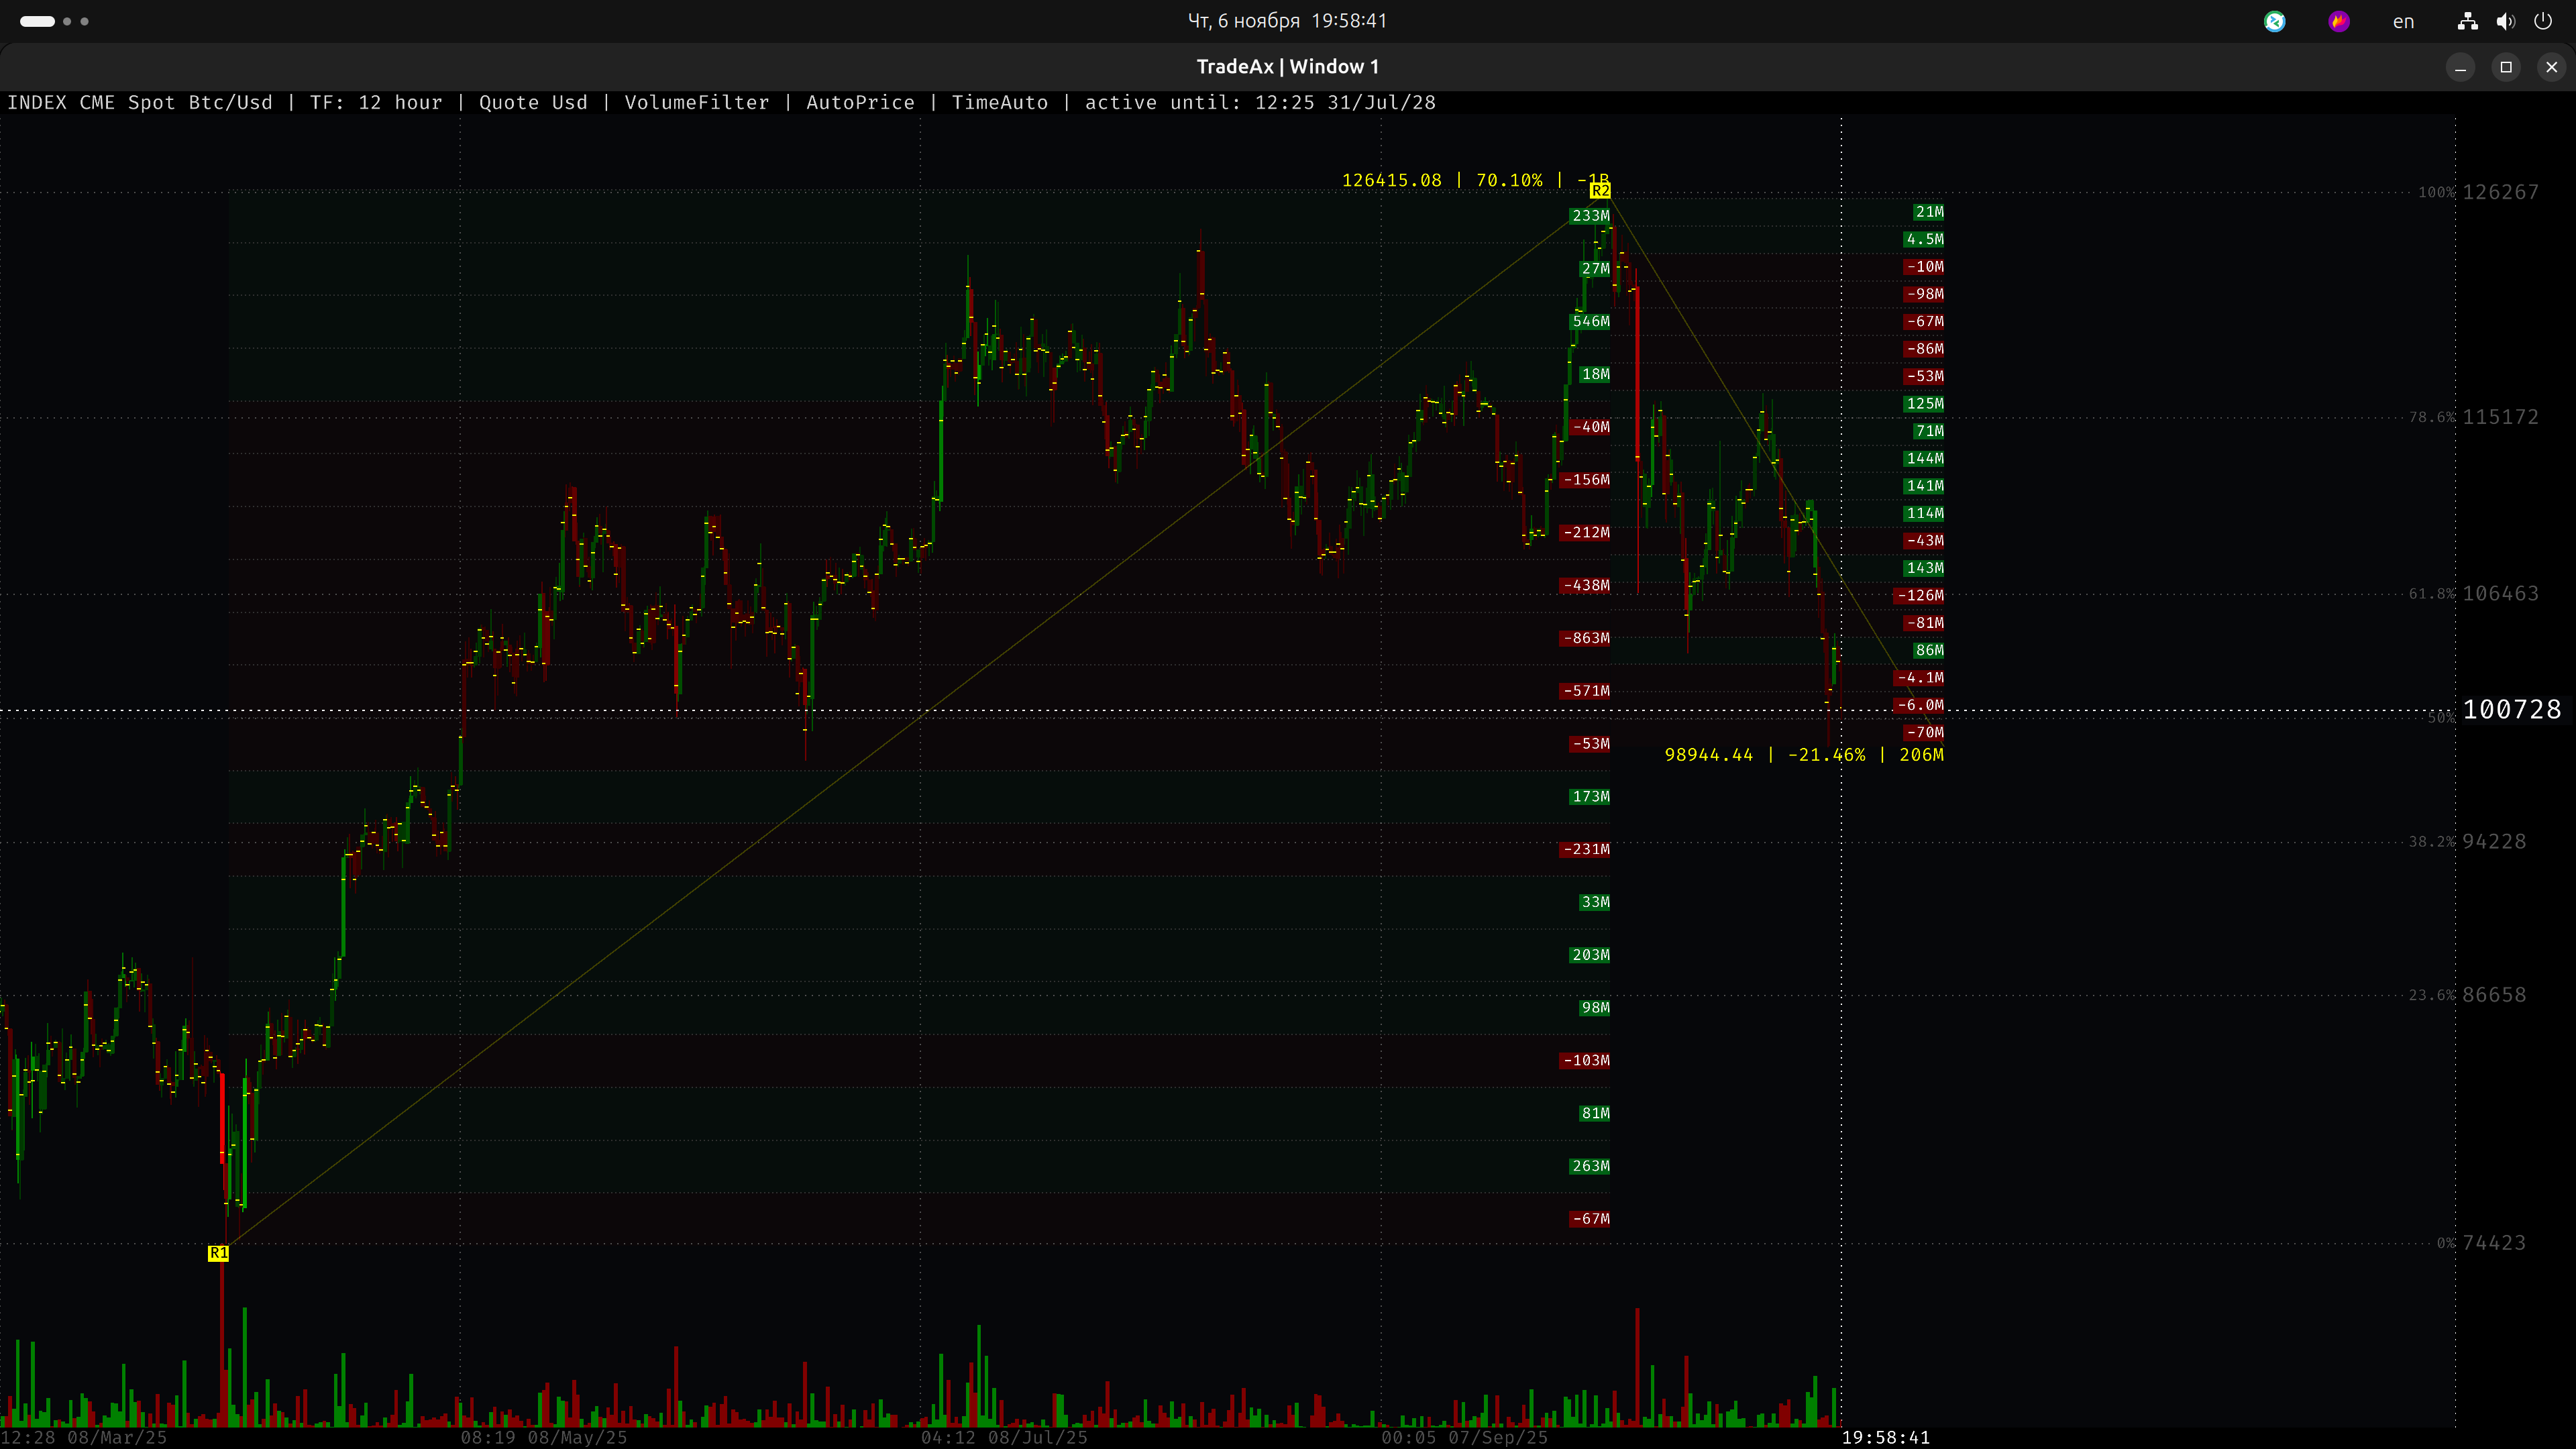
Инструмент позволяет вручную выделить на графике интересующий вас ценовой диапазон и мгновенно получить детальный анализ дельты по каждому ценовому уровню внутри этой зоны. Вы видите, где сосредоточены реальные объемы покупок и продаж, определяя истинные точки поддержки и сопротивления.
⚡ 6. RAW DATA & PRECISION: РАБОТАЙТЕ С ДАННЫМИ, А НЕ С МУЛЯЖАМИ
Пока TradingView кормит вас «усреднёнными» свечами и «плавающими» линиями, мы предоставляем прямой доступ к рыночной реальности. Их график — это детская раскраска. Наш — это высокоточная карта местности для спецназа.
🚫 ПОЗОРНЫЕ ПРАКТИКИ TRADINGVIEW, КОТОРЫЕ СТОЯТ ВАМ ДЕНЕГ:
- Свечи-фантомы. Их High и Low — это лишь усреднённый диапазон, а не реальные ценовые экстремумы. Вы видите смазанную картинку, а не то, что было на самом деле.
- Профанация точности. Ваша разметка плывёт, как только вы меняете таймфрейм, потому что их движок не привязан к тикам. Это уровень любительского софта, недопустимый для серьёзных сделок.
- Бедная история. Глубинный анализ на их платформе невозможен. Вы работаете с «огрызками» данных, которые они считают достаточными для своей аудитории начинающих.
✅ НАША ФИЛОСОФИЯ — ТОЧНОСТЬ, А НЕ УДОБСТВО ДЛЯ ДИЛЕТАНТОВ:
- Экстремумы с привязкой к миллисекунде. Каждый пик на нашем графике — это не «зона», а точная цена в конкретный момент времени. Вы видите реальную борьбу быков и медведей, а не её аппроксимацию.
- Незыблемая разметка. Линия, которую вы провели, останется на своей цене навсегда. Она привязана к тиковым данным, а не к геометрии свечи. Ваш анализ — это закон.
- Полная историческая глубина. Анализируйте минутные бары пятилетней давности с тем же уровнем детализации, что и текущие. Мы не обрезаем и не «усредняем» историю для экономии ресурсов.
Мы не соревнуемся с их «песочницей». Мы предоставляем инструмент, который не обманывает. Они развлекают толпу красивыми графиками. Мы даём вам стальное тактическое преимущество.
Анализируем сделок в секунду, рассчитываем дельты по всему рынку
Источников данных для анализа торгуемых пар
Создаем индексов для spot | futures | both, общие по рынку и отдельно по поставщикам индекса для CME
💰 ТОРГУЙТЕ С ПРИБЫЛЬЮ ВМЕСТЕ С TRADEAX
Объединяйте данные с десятков бирж в одном графике и получите доступ к уникальным технологиям, которые раньше были доступны только крупным фондам. С TradeAx вы сможете:
Анализировать рынок глубже:
Все биржи в одном месте для
полной картины.
Использовать профессиональные инструменты:
Технологии,
которые дают вам
преимущество.
Торговать с уверенностью:
Принимайте решения на основе
точных данных и передовых
решений.